emooki
HomePrice mapTransactions
🇬🇧 English🇫🇷 Français🇩🇪 Deutsch🇪🇸 Español🇮🇹 Italiano

Real estate price map


Real estate price map in the municipality of Issy-les-Moulineaux.

Hauts-de-Seine (92)
Issy-les-Moulineaux

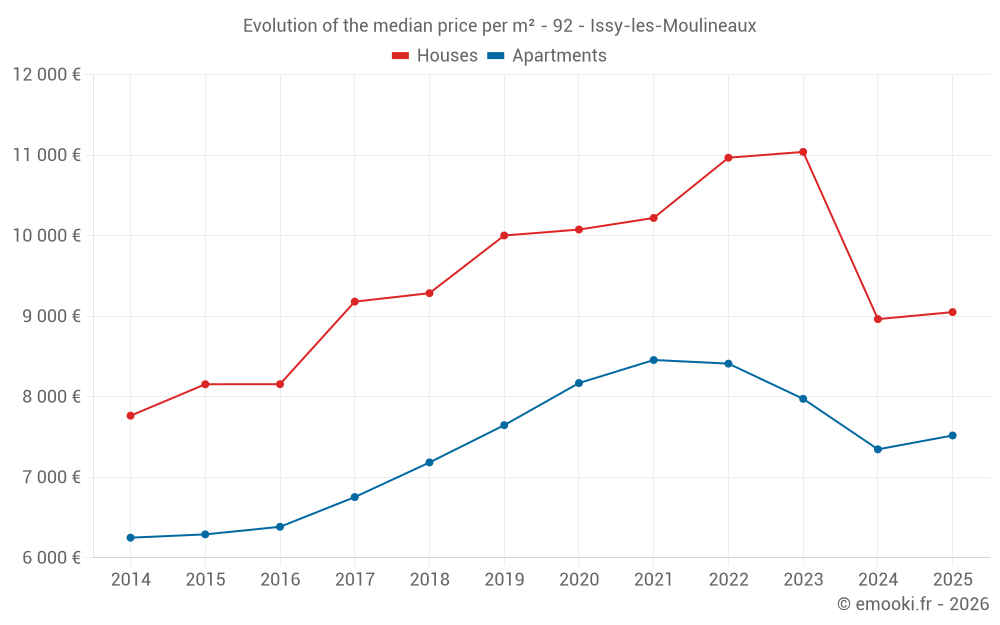
Median price of real estate
in the municipality of Issy-les-Moulineaux

HousesHouses
9 051 € /m²
1-23-45-67-89-10
Reliability 9/10
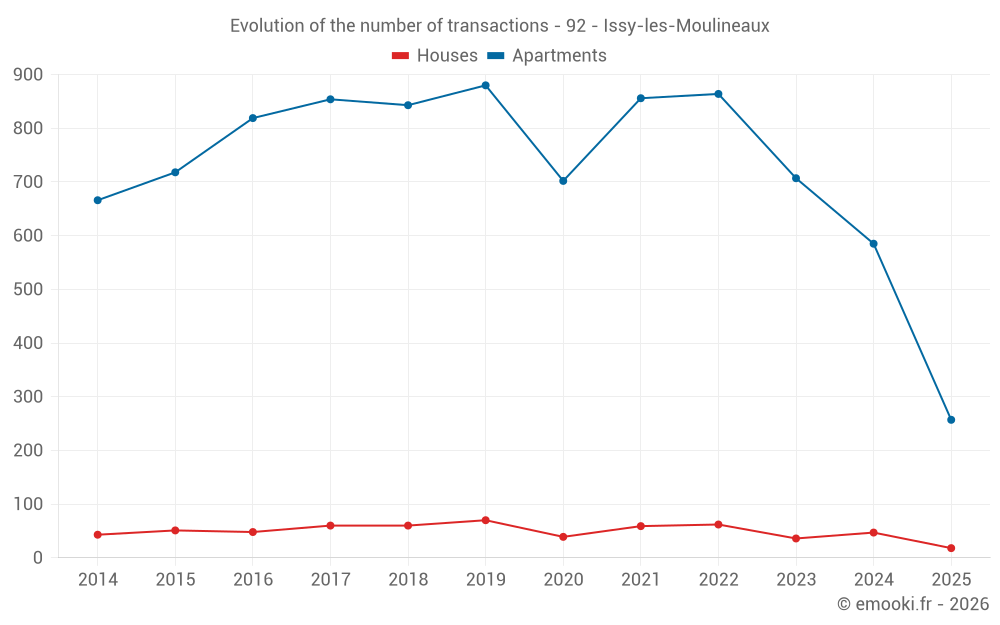
Median price on the 18 transactions of the last 6 months.
from 8 387 to
11 311 € /m²
60% of transactions from the 2nd to the 8th deciles.
ApartmentsApartments
7 622 € /m²
1-23-45-67-89-10
Reliability 10/10
Median price on the 80 transactions of the last 3 months.
from 6 038 to
8 587 € /m²
60% of transactions from the 2nd to the 8th deciles.
DwellingsDwellings
7 803 € /m²
1-23-45-67-89-10
Reliability 10/10
Median price on the 87 transactions of the last 3 months.
from 6 169 to
8 716 € /m²
60% of transactions from the 2nd to the 8th deciles.
HousesEvolution of the price per m² of houses since...
1 year
+1%
2 years
-18%
3 years
-17%
4 years
-11%
5 years
-10%
6 years
-10%
7 years
-2.5%
8 years
-1.4%
9 years
+11%
10 years
+11%
11 years
+17%
ApartmentsEvolution of the price per m² of apartments since...
1 year
+2.3%
2 years
-5.7%
3 years
-11%
4 years
-11%
5 years
-8%
6 years
-1.7%
7 years
+4.7%
8 years
+11%
9 years
+18%
10 years
+20%
11 years
+20%

Yearly evolution

Evolution of the median price per m²

Evolution of the number of transactions

Warning, last year incomplete. Projections made based on the proportions between semesters of the previous year at the departmental/national level and by type of property.

Yearly data

Descending order
Year
Houses
house
transactions
Houses
house
Price per m²
Apartments
apt.
transactions
Apartments
apt.
Price per m²
2025
18
9 051 €
257
7 519 €
2024
47
8 964 €
585
7 347 €
2023
36
11 040 €
707
7 974 €
2022
62
10 968 €
864
8 411 €
2021
59
10 220 €
856
8 456 €
2020
39
10 076 €
702
8 170 €
2019
70
10 002 €
880
7 647 €
2018
60
9 286 €
843
7 184 €
2017
60
9 181 €
854
6 754 €
2016
48
8 156 €
819
6 385 €
2015
51
8 155 €
718
6 291 €
2014
43
7 765 €
666
6 250 €

Analysis

Structure of prices per m²

Values of price percentiles per m² over the periods used for the estimated price of each type of property.

Structure of transaction amounts

Values of transaction amounts percentiles over the periods used for the estimated price of each type of property.

Transaction amounts and prices per m² by percentile

Ascending order
Percentile
Houses
house
Price per m²
Houses
house
Transaction amount
Apartments
apt.
Price per m²
Apartments
apt.
Transaction amount
10th percentile
7 615 €
704 K€
5 202 €
138 K€
20th percentile
8 387 €
796 K€
6 038 €
185 K€
30th percentile
8 707 €
853 K€
6 593 €
227 K€
40th percentile
8 919 €
905 K€
7 148 €
264 K€
50th percentile
9 051 €
1 001 K€
7 622 €
314 K€
60th percentile
9 298 €
1 080 K€
8 000 €
392 K€
70th percentile
10 321 €
1 127 K€
8 324 €
470 K€
80th percentile
11 311 €
1 204 K€
8 587 €
518 K€
90th percentile
16 505 €
1 299 K€
9 294 €
731 K€

National and departmental comparison

Evolution of the median price per m² of houses

Evolution of the median price per m² of apartments

Quarterly evolution

Evolution of the median price per m²

Evolution of the number of transactions

Quarterly data

Descending order
Quarter
Houses
house
transactions
Houses
house
Price per m²
Apartments
apt.
transactions
Apartments
apt.
Price per m²
2025 Q2
7
8 845 €
80
7 622 €
2025 Q1
11
9 565 €
177
7 467 €
2024 Q4
12
8 606 €
131
7 253 €
2024 Q3
14
8 765 €
156
7 456 €
2024 Q2
8
9 948 €
159
7 347 €
2024 Q1
13
9 554 €
139
7 299 €
2023 Q4
7
9 581 €
127
7 727 €
2023 Q3
10
11 535 €
198
7 994 €
2023 Q2
8
11 608 €
191
7 917 €
2023 Q1
11
9 674 €
191
8 309 €
2022 Q4
18
9 946 €
201
8 276 €
2022 Q3
15
10 935 €
249
8 673 €
2022 Q2
15
11 093 €
220
8 182 €
2022 Q1
14
11 445 €
194
8 400 €
2021 Q4
13
10 182 €
202
8 360 €
2021 Q3
21
8 857 €
260
8 534 €
2021 Q2
11
12 340 €
235
8 430 €
2021 Q1
14
10 282 €
159
8 443 €
2020 Q4
11
10 076 €
220
8 450 €
2020 Q3
11
10 385 €
167
8 218 €
2020 Q2
6
9 474 €
167
8 051 €
2020 Q1
11
9 714 €
148
8 056 €
2019 Q4
16
9 963 €
221
7 619 €
2019 Q3
21
9 941 €
250
7 941 €
2019 Q2
19
9 363 €
186
7 416 €
2019 Q1
14
10 883 €
223
7 514 €
2018 Q4
15
9 273 €
225
7 288 €
2018 Q3
12
9 472 €
216
7 404 €
2018 Q2
13
11 181 €
196
7 224 €
2018 Q1
20
8 782 €
206
6 834 €
2017 Q4
5
10 000 €
185
6 867 €
2017 Q3
20
9 914 €
234
7 091 €
2017 Q2
24
10 260 €
236
6 481 €
2017 Q1
11
7 240 €
199
6 517 €
2016 Q4
7
8 545 €
211
6 569 €
2016 Q3
18
7 788 €
239
6 517 €
2016 Q2
16
8 428 €
189
6 140 €
2016 Q1
7
6 203 €
180
6 283 €
2015 Q4
14
8 135 €
158
6 134 €
2015 Q3
16
8 290 €
226
6 440 €
2015 Q2
13
6 824 €
186
6 280 €
2015 Q1
8
7 381 €
148
6 248 €
2014 Q4
9
8 656 €
154
6 324 €
2014 Q3
15
7 407 €
179
6 297 €
2014 Q2
10
6 031 €
155
6 184 €
2014 Q1
9
9 000 €
178
6 191 €

Hauts-de-Seine (92)

Most expensive cities

City
name
Descending orderHouses
house
Price per m²
16 016 €
12 810 €
11 628 €
9 715 €
9 566 €
9 231 €
9 146 €
9 051 €
8 920 €
8 847 €
City
name
Descending orderApartments
apt.
Price per m²
10 322 €
8 698 €
8 268 €
7 622 €
7 427 €
7 273 €
6 798 €
6 758 €
6 620 €
6 509 €

Least expensive cities

City
name
Ascending orderHouses
house
Price per m²
4 004 €
5 066 €
5 862 €
6 081 €
6 219 €
6 364 €
6 630 €
6 632 €
6 656 €
6 662 €
City
name
Ascending orderApartments
apt.
Price per m²
2 814 €
3 740 €
4 418 €
4 434 €
4 724 €
4 773 €
4 839 €
4 868 €
4 941 €
5 058 €