emooki
HomePrice mapTransactions
🇬🇧 English🇫🇷 Français🇩🇪 Deutsch🇪🇸 Español🇮🇹 Italiano

Real estate price map


Real estate price map in the municipality of Ville-d'Avray, choose a section to see transactions by parcel.

Hauts-de-Seine (92)
Ville-d'Avray

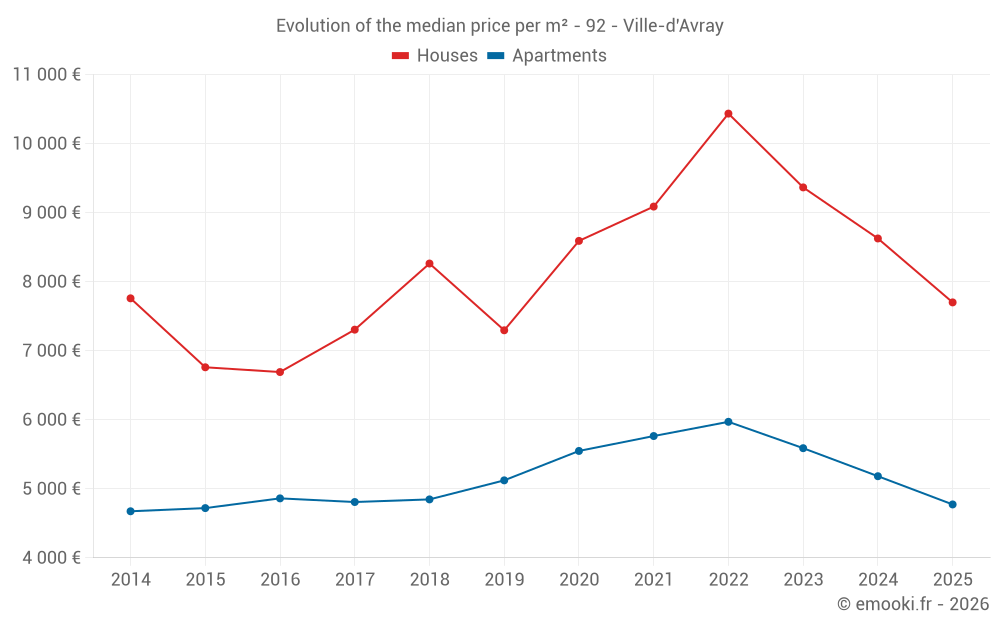
Median price of real estate
in the municipality of Ville-d'Avray

HousesHouses
7 865 € /m²
1-23-45-67-89-10
Reliability 8/10
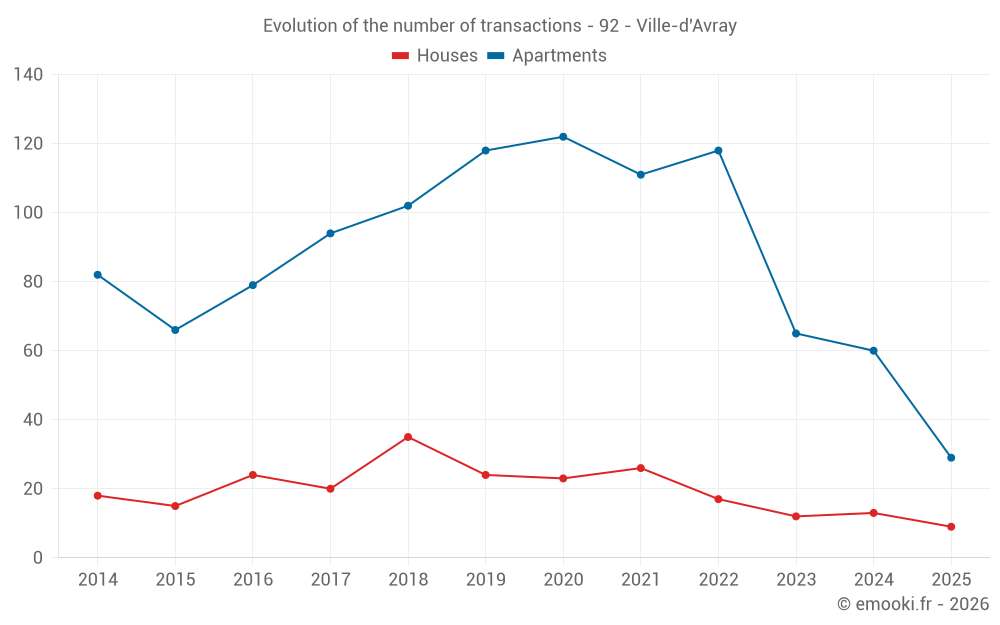
Median price on the 16 transactions of the last 12 months.
from 5 864 to
9 244 € /m²
60% of transactions from the 2nd to the 8th deciles.
ApartmentsApartments
4 773 € /m²
1-23-45-67-89-10
Reliability 9/10
Median price on the 29 transactions of the last 6 months.
from 3 742 to
6 124 € /m²
60% of transactions from the 2nd to the 8th deciles.
DwellingsDwellings
5 342 € /m²
1-23-45-67-89-10
Reliability 9/10
Median price on the 38 transactions of the last 6 months.
from 3 766 to
6 622 € /m²
60% of transactions from the 2nd to the 8th deciles.
HousesEvolution of the price per m² of houses since...
1 year
-11%
2 years
-18%
3 years
-26%
4 years
-15%
5 years
-10%
6 years
+5.5%
7 years
-6.8%
8 years
+5.4%
9 years
+15%
10 years
+14%
11 years
-0.8%
The price per m² of houses has decreased by 26% since 3 years, but it has increased by 15% in 9 years.
ApartmentsEvolution of the price per m² of apartments since...
1 year
-7.9%
2 years
-15%
3 years
-20%
4 years
-17%
5 years
-14%
6 years
-6.8%
7 years
-1.5%
8 years
-0.7%
9 years
-1.8%
10 years
+1.1%
11 years
+2.1%
The price per m² of apartments has decreased by 20% since 3 years, but it has increased by 2.1% in 11 years.

Yearly evolution

Evolution of the median price per m²

Evolution of the number of transactions

Warning, last year incomplete. Projections made based on the proportions between semesters of the previous year at the departmental/national level and by type of property.

Yearly data

Descending order
Year
Houses
house
transactions
Houses
house
Price per m²
Apartments
apt.
transactions
Apartments
apt.
Price per m²
2025
9
7 700 €
29
4 773 €
2024
13
8 626 €
60
5 182 €
2023
12
9 366 €
65
5 588 €
2022
17
10 435 €
118
5 970 €
2021
26
9 088 €
111
5 764 €
2020
23
8 591 €
122
5 548 €
2019
24
7 296 €
118
5 122 €
2018
35
8 263 €
102
4 846 €
2017
20
7 305 €
94
4 808 €
2016
24
6 691 €
79
4 861 €
2015
15
6 760 €
66
4 720 €
2014
18
7 759 €
82
4 674 €

Analysis

Structure of prices per m²

Values of price percentiles per m² over the periods used for the estimated price of each type of property.

Structure of transaction amounts

Values of transaction amounts percentiles over the periods used for the estimated price of each type of property.

Transaction amounts and prices per m² by percentile

Ascending order
Percentile
Houses
house
Price per m²
Houses
house
Transaction amount
Apartments
apt.
Price per m²
Apartments
apt.
Transaction amount
10th percentile
4 792 €
893 K€
3 238 €
111 K€
20th percentile
5 864 €
950 K€
3 742 €
203 K€
30th percentile
6 786 €
993 K€
3 916 €
236 K€
40th percentile
7 700 €
1 002 K€
4 303 €
280 K€
50th percentile
7 865 €
1 019 K€
4 773 €
300 K€
60th percentile
8 003 €
1 056 K€
5 255 €
341 K€
70th percentile
8 550 €
1 186 K€
5 551 €
527 K€
80th percentile
9 244 €
1 266 K€
6 124 €
552 K€
90th percentile
9 648 €
1 676 K€
6 314 €
590 K€

National and departmental comparison

Evolution of the median price per m² of houses

Evolution of the median price per m² of apartments

Quarterly evolution

Evolution of the median price per m²

Evolution of the number of transactions

Quarterly data

Descending order
Quarter
Houses
house
transactions
Houses
house
Price per m²
Apartments
apt.
transactions
Apartments
apt.
Price per m²
2025 Q2
2
6 782 €
11
5 164 €
2025 Q1
7
7 835 €
18
4 749 €
2024 Q4
3
6 868 €
17
5 274 €
2024 Q3
4
9 298 €
13
5 323 €
2024 Q2
2
8 680 €
18
4 968 €
2024 Q1
4
8 520 €
12
5 186 €
2023 Q4
6
8 558 €
12
5 196 €
2023 Q3
3
12 908 €
19
5 800 €
2023 Q2
3
9 665 €
19
5 203 €
2023 Q1
0
--- €
15
5 850 €
2022 Q4
8
10 186 €
25
5 814 €
2022 Q3
2
11 884 €
29
6 369 €
2022 Q2
4
10 102 €
32
5 901 €
2022 Q1
3
10 188 €
32
6 010 €
2021 Q4
3
11 081 €
28
5 880 €
2021 Q3
14
9 572 €
33
6 007 €
2021 Q2
4
8 652 €
26
5 572 €
2021 Q1
5
7 469 €
24
5 308 €
2020 Q4
3
9 062 €
29
5 690 €
2020 Q3
5
8 792 €
31
5 646 €
2020 Q2
6
8 672 €
29
5 625 €
2020 Q1
9
7 879 €
33
5 294 €
2019 Q4
2
10 312 €
27
5 317 €
2019 Q3
9
8 361 €
28
5 366 €
2019 Q2
4
5 262 €
31
4 671 €
2019 Q1
9
7 227 €
32
4 919 €
2018 Q4
11
8 233 €
29
5 427 €
2018 Q3
7
7 962 €
33
4 846 €
2018 Q2
11
8 409 €
18
4 652 €
2018 Q1
6
7 700 €
22
4 745 €
2017 Q4
2
7 984 €
16
4 884 €
2017 Q3
4
7 248 €
31
5 055 €
2017 Q2
10
7 386 €
23
4 354 €
2017 Q1
4
6 784 €
24
5 049 €
2016 Q4
4
7 466 €
12
4 626 €
2016 Q3
7
6 350 €
21
5 071 €
2016 Q2
12
7 160 €
26
4 878 €
2016 Q1
1
1 286 €
20
4 649 €
2015 Q4
3
6 399 €
17
4 824 €
2015 Q3
5
7 703 €
13
4 867 €
2015 Q2
5
7 619 €
22
4 622 €
2015 Q1
2
6 410 €
14
4 580 €
2014 Q4
3
8 591 €
24
4 720 €
2014 Q3
9
7 725 €
18
4 668 €
2014 Q2
3
6 209 €
26
4 793 €
2014 Q1
3
8 152 €
14
4 549 €

Overview of the latest real estate transactions

The following list is an anonymized overview of the latest transactions. For more details and to find all transactions, please use the map to view transactions by plot or the transaction search page for a search by criteria.

2025-06-30
90 000 €
Sale
1 outbuilding
2025-06-26
285 000 €
4 130 € /m²(69 m²)
Sale
Apartments
Apartment
2 rooms
69 m2
1 outbuilding
1 outbuilding
2025-06-24
64 020 €
Sale
1 outbuilding
2025-06-18
95 000 €
720 € /m²(132 m²)
Sale
Apartments
Apartment
5 rooms
132 m2
1 outbuilding
2025-06-16
115 000 €
Sale
1 outbuilding
2025-06-10
204 400 €
3 407 € /m²(60 m²)
Sale
Apartments
Apartment
3 rooms
60 m2
2025-06-10
23 000 €
Sale
1 outbuilding
2025-06-10
793 500 €
6 151 € /m²(129 m²)
Sale
Apartments
Apartment
3 rooms
129 m2
3 outbuildings
2025-06-10
90 000 €
Sale
1 outbuilding
2025-05-27
8 500 €
Sale
1 outbuilding
2025-05-26
548 000 €
6 937 € /m²(79 m²)
Sale
Apartments
Apartment
5 rooms
79 m2
4 outbuildings
2025-05-22
25 000 €
Sale
1 outbuilding
2025-05-21
63 000 €
Sale
1 outbuilding
2025-05-15
770 000 €
7 700 € /m²(100 m²)
Sale
Houses
House
6 rooms
100 m2
Land
286 m2
-Sols
2025-05-14
55 000 €
Sale
1 outbuilding
2025-05-05
40 000 €
Sale
1 outbuilding
2025-05-05
233 000 €
5 548 € /m²(42 m²)
Sale
Apartments
Apartment
1 room
42 m2
1 outbuilding
2025-05-05
289 160 €
5 164 € /m²(56 m²)
Sale
Apartments
Apartment
3 rooms
56 m2
1 outbuilding
2025-04-30
1 055 500 €
5 864 € /m²(180 m²)
Sale
Houses
House
5 rooms
180 m2
Land
310 m2
-Sols
2025-04-30
556 800 €
3 569 € /m²(156 m²)
7 524 € /m²(74 m²)
Sale
Apartments
Apartment
3 rooms
74 m2
Commercial property
58 m2
Commercial property
24 m2
4 outbuildings
Land
420 m2
-Sols

Hauts-de-Seine (92)

Most expensive cities

City
name
Descending orderHouses
house
Price per m²
16 016 €
12 810 €
11 628 €
9 715 €
9 566 €
9 231 €
9 146 €
9 051 €
8 920 €
8 847 €
City
name
Descending orderApartments
apt.
Price per m²
10 322 €
8 698 €
8 268 €
7 622 €
7 427 €
7 273 €
6 798 €
6 758 €
6 620 €
6 509 €

Least expensive cities

City
name
Ascending orderHouses
house
Price per m²
4 004 €
5 066 €
5 862 €
6 081 €
6 219 €
6 364 €
6 630 €
6 632 €
6 656 €
6 662 €
City
name
Ascending orderApartments
apt.
Price per m²
2 814 €
3 740 €
4 418 €
4 434 €
4 724 €
4 773 €
4 839 €
4 868 €
4 941 €
5 058 €