emooki
SearchPrice mapTransactions
EnglishFrançaisDeutschEspañolItaliano

Real estate price map


Real estate price map in the municipality of Longpont-sur-Orge.

Essonne (91)
Longpont-sur-Orge

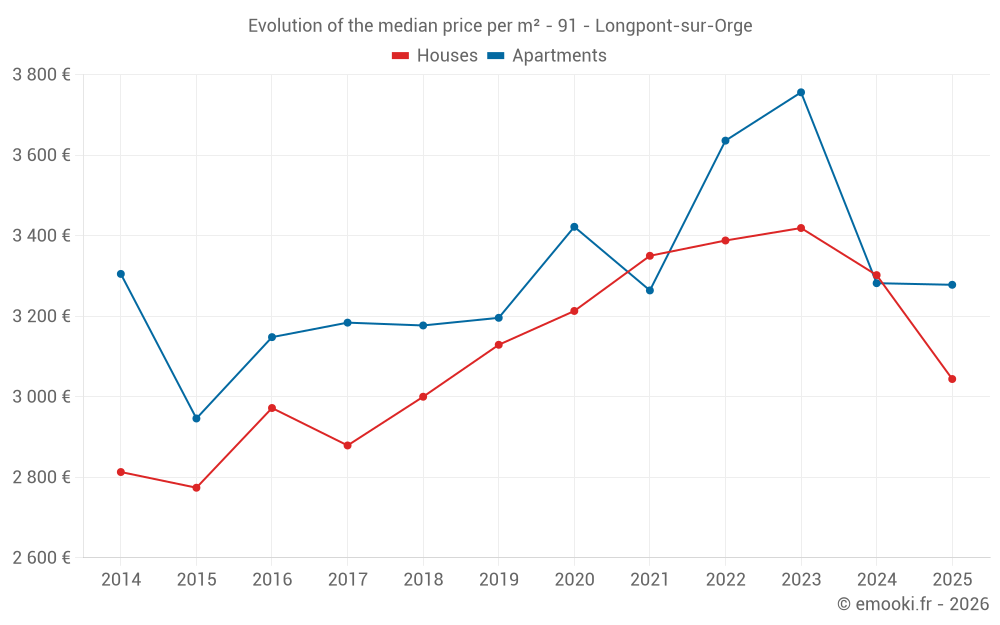
Median price of real estate
in the municipality of Longpont-sur-Orge

HousesHouses
3 152 € /m²
1-23-45-67-89-10
Reliability 8/10
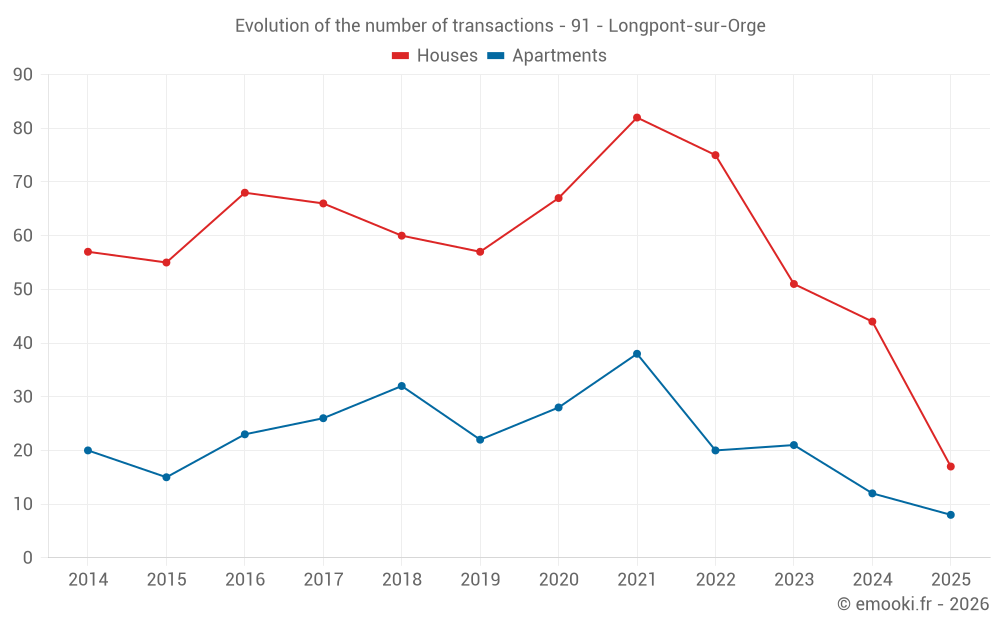
Median price on the 43 transactions of the last 12 months.
from 2 698 to
3 528 € /m²
60% of transactions from the 2nd to the 8th deciles.
ApartmentsApartments
3 381 € /m²
1-23-45-67-89-10
Reliability 7/10
Median price on the 29 transactions of the last 24 months.
from 3 065 to
3 983 € /m²
60% of transactions from the 2nd to the 8th deciles.
DwellingsDwellings
3 200 € /m²
1-23-45-67-89-10
Reliability 9/10
Median price on the 25 transactions of the last 6 months.
from 2 728 to
3 513 € /m²
60% of transactions from the 2nd to the 8th deciles.
HousesEvolution of the price per m² of houses
1 year
-7.8%
2 years
-11%
3 years
-10.2%
4 years
-9.1%
5 years
-5.3%
6 years
-2.7%
7 years
+1.5%
8 years
+5.7%
9 years
+2.4%
10 years
+9.7%
11 years
+8.2%
ApartmentsEvolution of the price per m² of apartments
1 year
-0.1%
2 years
-12.7%
3 years
-9.8%
4 years
+0.4%
5 years
-4.2%
6 years
+2.6%
7 years
+3.2%
8 years
+3%
9 years
+4.1%
10 years
+11.3%
11 years
-0.8%

Yearly evolution

Median price per m²

Number of transactions

Warning, last year incomplete. Projections made based on the proportions between semesters of the previous year at the departmental/national level and by type of property.

Yearly data

Descending order
Year
Houses
house
Price per m²
Houses
house
transactions
Apartments
apt.
Price per m²
Apartments
apt.
transactions
2025
3 044 €
17
3 278 €
8
2024
3 302 €
44
3 282 €
12
2023
3 419 €
51
3 756 €
21
2022
3 388 €
75
3 636 €
20
2021
3 350 €
82
3 264 €
38
2020
3 213 €
67
3 422 €
28
2019
3 129 €
57
3 196 €
22
2018
3 000 €
60
3 177 €
32
2017
2 879 €
66
3 184 €
26
2016
2 972 €
68
3 148 €
23
2015
2 774 €
55
2 946 €
15
2014
2 813 €
57
3 305 €
20

Quarterly evolution

Median price per m²

Number of transactions

Analysis

Structure of prices per m²

Values of price percentiles per m² over the periods used for the estimated price of each type of property.

Essonne (91)

Most expensive cities

City
name
Descending orderHouses
house
Price per m²
5 484 €
5 052 €
4 784 €
4 710 €
4 491 €
4 362 €
4 244 €
City
name
Descending orderApartments
apt.
Price per m²
5 783 €
5 520 €
4 708 €
4 222 €
4 212 €
4 198 €

Least expensive cities

City
name
Ascending orderHouses
house
Price per m²
1 714 €
1 801 €
1 833 €
1 868 €
1 905 €
1 914 €
1 967 €
2 000 €
2 095 €
City
name
Ascending orderApartments
apt.
Price per m²
1 066 €
1 135 €
1 194 €
1 209 €
1 354 €
1 719 €
emooki
Real estate statistics based on property value requests (DVF)
Need a specific analysis or dashboards, contact us