emooki
SearchPrice mapTransactions
🇬🇧 English🇫🇷 Français🇩🇪 Deutsch🇪🇸 Español🇮🇹 Italiano

Real estate price map


Real estate price map in the municipality of Brétigny-sur-Orge.

Essonne (91)
Brétigny-sur-Orge

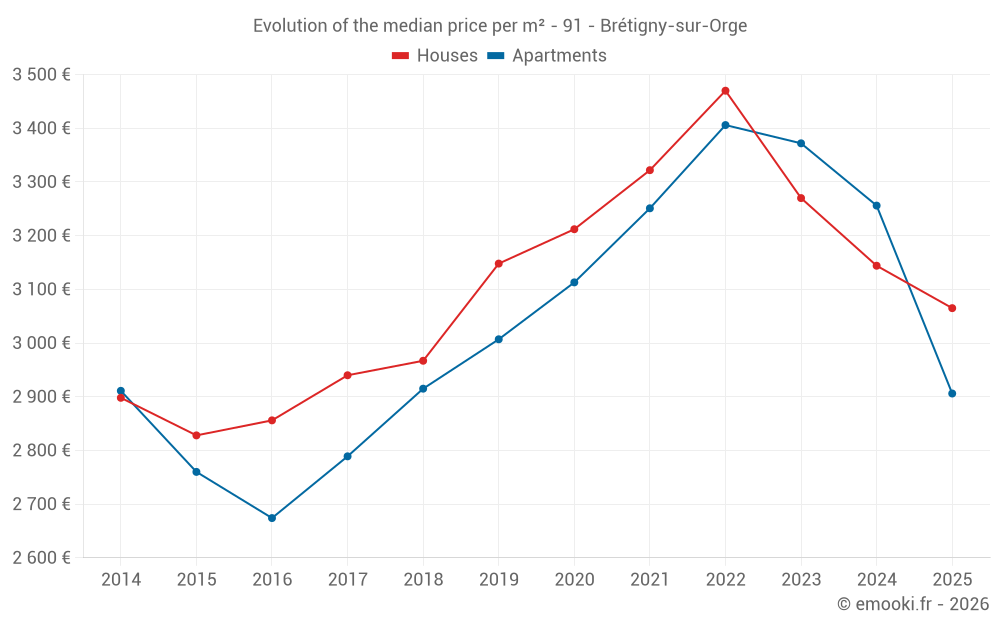
Median price of real estate
in the municipality of Brétigny-sur-Orge

HousesHouses
3 065 € /m²
1-23-45-67-89-10
Reliability 9/10
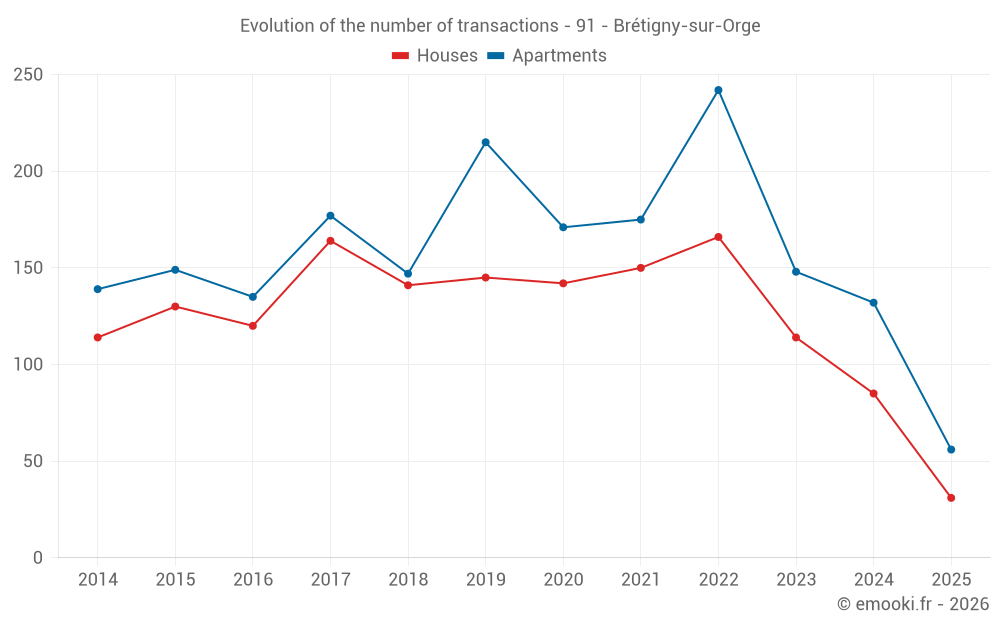
Median price on the 31 transactions of the last 6 months.
from 2 468 to
3 815 € /m²
60% of transactions from the 2nd to the 8th deciles.
ApartmentsApartments
2 906 € /m²
1-23-45-67-89-10
Reliability 9/10
Median price on the 56 transactions of the last 6 months.
from 2 161 to
3 723 € /m²
60% of transactions from the 2nd to the 8th deciles.
DwellingsDwellings
2 222 € /m²
1-23-45-67-89-10
Reliability 10/10
Median price on the 24 transactions of the last 3 months.
from 1 839 to
3 479 € /m²
60% of transactions from the 2nd to the 8th deciles.
HousesEvolution of the price per m² of houses
1 year
-2.5%
2 years
-6.3%
3 years
-11.7%
4 years
-7.7%
5 years
-4.6%
6 years
-2.6%
7 years
+3.3%
8 years
+4.3%
9 years
+7.3%
10 years
+8.4%
11 years
+5.8%
ApartmentsEvolution of the price per m² of apartments
1 year
-10.7%
2 years
-13.8%
3 years
-14.7%
4 years
-10.6%
5 years
-6.6%
6 years
-3.4%
7 years
-0.3%
8 years
+4.2%
9 years
+8.7%
10 years
+5.3%
11 years
-0.2%

Yearly evolution

Median price per m²

Number of transactions

Warning, last year incomplete. Projections made based on the proportions between semesters of the previous year at the departmental/national level and by type of property.

Yearly data

Descending order
Year
Houses
house
Price per m²
Houses
house
transactions
Apartments
apt.
Price per m²
Apartments
apt.
transactions
2025
3 065 €
31
2 906 €
56
2024
3 144 €
85
3 256 €
132
2023
3 270 €
114
3 372 €
148
2022
3 470 €
166
3 406 €
242
2021
3 322 €
150
3 251 €
175
2020
3 212 €
142
3 113 €
171
2019
3 148 €
145
3 007 €
215
2018
2 967 €
141
2 915 €
147
2017
2 940 €
164
2 789 €
177
2016
2 856 €
120
2 674 €
135
2015
2 828 €
130
2 760 €
149
2014
2 898 €
114
2 911 €
139

Quarterly evolution

Median price per m²

Number of transactions

Analysis

Structure of prices per m²

Values of price percentiles per m² over the periods used for the estimated price of each type of property.

Essonne (91)

Most expensive cities

City
name
Descending orderHouses
house
Price per m²
5 484 €
5 052 €
4 784 €
4 710 €
4 491 €
4 362 €
4 244 €
City
name
Descending orderApartments
apt.
Price per m²
5 783 €
5 520 €
4 708 €
4 222 €
4 212 €
4 198 €

Least expensive cities

City
name
Ascending orderHouses
house
Price per m²
1 714 €
1 801 €
1 833 €
1 868 €
1 905 €
1 914 €
1 967 €
2 000 €
2 095 €
City
name
Ascending orderApartments
apt.
Price per m²
1 066 €
1 135 €
1 194 €
1 209 €
1 354 €
1 719 €