emooki
HomePrice mapTransactions
🇬🇧 English🇫🇷 Français🇩🇪 Deutsch🇪🇸 Español🇮🇹 Italiano

Real estate price map


Real estate price map in the municipality of Épinay-sous-Sénart, choose a section to see transactions by parcel.

Essonne (91)
Épinay-sous-Sénart

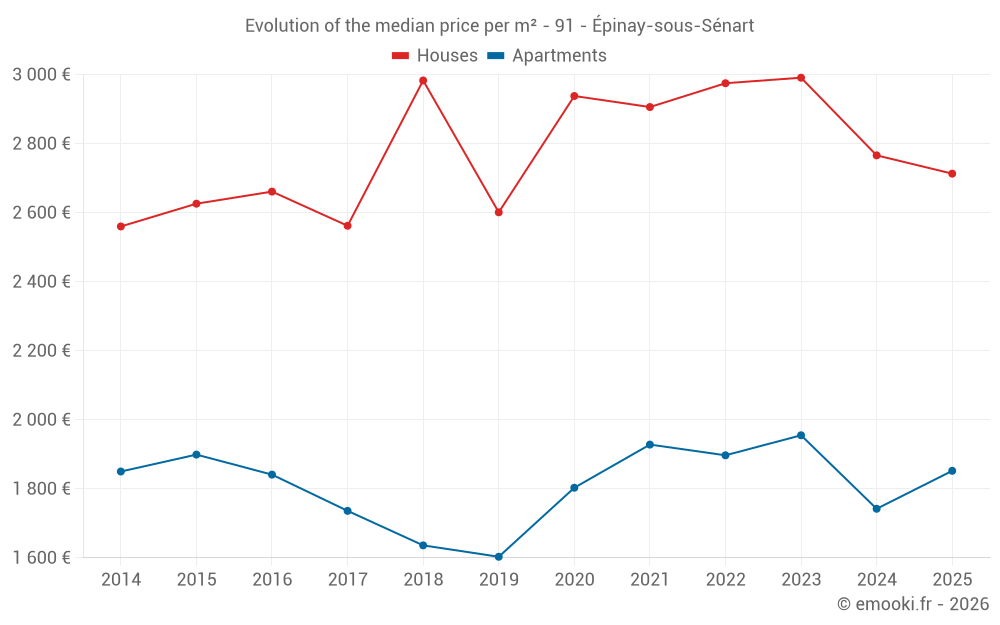
Median price of real estate
in the municipality of Épinay-sous-Sénart

HousesHouses
2 800  /m²
1-23-45-67-89-10
Reliability 7/10
Median price on the 36 transactions of the last 24 months.
from 2 391 to
3 301  /m²
60% of transactions from the 2nd to the 8th deciles.
ApartmentsApartments
1 852  /m²
1-23-45-67-89-10
Reliability 9/10
Median price on the 18 transactions of the last 6 months.
from 1 710 to
2 063  /m²
60% of transactions from the 2nd to the 8th deciles.
DwellingsDwellings
1 986  /m²
1-23-45-67-89-10
Reliability 9/10
Median price on the 24 transactions of the last 6 months.
from 1 780 to
2 601  /m²
60% of transactions from the 2nd to the 8th deciles.
HousesEvolution of the price per m² of houses since...
1 year
-1.9%
2 years
-9.3%
3 years
-8.8%
4 years
-6.6%
5 years
-7.7%
6 years
+4.3%
7 years
-9.1%
8 years
+5.9%
9 years
+2%
10 years
+3.3%
11 years
+6%
The price per m² of houses has decreased by 9.3% since 2 years, but it has increased by 6% in 11 years.
ApartmentsEvolution of the price per m² of apartments since...
1 year
+6.3%
2 years
-5.3%
3 years
-2.4%
4 years
-3.9%
5 years
+2.7%
6 years
+16%
7 years
+13%
8 years
+6.7%
9 years
+0.6%
10 years
-2.5%
11 years
+0.1%
The price per m² of apartments has decreased by 5.3% since 2 years, but it has increased by 16% in 6 years.

Yearly evolution

Evolution of the median price per m²

Evolution of the number of transactions

Warning, last year incomplete. Projections made based on the proportions between semesters of the previous year at the departmental/national level and by type of property.

Yearly data

Descending order
Year
Houses
house
transactions
Houses
house
Price per m²
Apartments
apt.
transactions
Apartments
apt.
Price per m²
2025
6
2 713 
18
1 852 
2024
18
2 766 
46
1 742 
2023
28
2 991 
70
1 955 
2022
29
2 975 
90
1 897 
2021
34
2 906 
90
1 928 
2020
44
2 938 
77
1 803 
2019
38
2 601 
91
1 603 
2018
27
2 983 
61
1 636 
2017
37
2 562 
82
1 736 
2016
35
2 661 
65
1 841 
2015
24
2 626 
58
1 899 
2014
20
2 560 
60
1 850 

Analysis

Structure of prices per m²

Values of price percentiles per m² over the periods used for the estimated price of each type of property.

Structure of transaction amounts

Values of transaction amounts percentiles over the periods used for the estimated price of each type of property.

Transaction amounts and prices per m² by percentile

Ascending order
Percentile
Houses
house
Price per m²
Houses
house
Transaction amount
Apartments
apt.
Price per m²
Apartments
apt.
Transaction amount
10th percentile
2 216 
170 K
1 575 
97 378 
20th percentile
2 391 
190 K
1 710 
110 K
30th percentile
2 672 
200 K
1 809 
114 K
40th percentile
2 750 
215 K
1 840 
130 K
50th percentile
2 800 
220 K
1 852 
136 K
60th percentile
2 955 
230 K
1 904 
138 K
70th percentile
3 054 
246 K
1 997 
142 K
80th percentile
3 301 
254 K
2 063 
148 K
90th percentile
3 511 
319 K
2 236 
162 K

National and departmental comparison

Evolution of the median price per m² of houses

Evolution of the median price per m² of apartments

Quarterly evolution

Evolution of the median price per m²

Evolution of the number of transactions

Quarterly data

Descending order
Quarter
Houses
house
transactions
Houses
house
Price per m²
Apartments
apt.
transactions
Apartments
apt.
Price per m²
2025 Q2
1
2 263 
5
2 036 
2025 Q1
5
2 750 
13
1 839 
2024 Q4
4
2 641 
13
1 829 
2024 Q3
4
2 648 
11
1 614 
2024 Q2
4
2 538 
11
1 841 
2024 Q1
6
3 310 
11
1 493 
2023 Q4
4
2 824 
14
2 052 
2023 Q3
8
3 000 
11
1 868 
2023 Q2
10
2 998 
28
1 882 
2023 Q1
6
3 196 
17
2 022 
2022 Q4
6
2 900 
18
1 884 
2022 Q3
9
3 282 
24
1 940 
2022 Q2
7
3 194 
21
1 836 
2022 Q1
7
2 958 
27
2 083 
2021 Q4
10
2 988 
19
1 986 
2021 Q3
12
2 752 
36
1 928 
2021 Q2
7
2 965 
14
1 888 
2021 Q1
5
2 652 
21
1 863 
2020 Q4
13
3 153 
22
1 803 
2020 Q3
11
2 938 
19
1 837 
2020 Q2
12
2 848 
18
1 906 
2020 Q1
8
2 942 
18
1 724 
2019 Q4
8
2 819 
18
1 672 
2019 Q3
11
2 554 
24
1 522 
2019 Q2
10
2 514 
27
1 442 
2019 Q1
9
2 662 
22
1 858 
2018 Q4
2
3 565 
12
1 602 
2018 Q3
17
2 983 
27
1 667 
2018 Q2
4
2 596 
12
1 607 
2018 Q1
4
3 260 
10
1 698 
2017 Q4
8
2 648 
24
1 679 
2017 Q3
14
2 343 
23
1 616 
2017 Q2
3
2 521 
20
1 833 
2017 Q1
12
2 734 
15
1 736 
2016 Q4
15
2 712 
23
1 907 
2016 Q3
10
2 526 
13
1 756 
2016 Q2
5
2 551 
13
1 855 
2016 Q1
5
2 563 
16
1 736 
2015 Q4
7
2 558 
11
1 857 
2015 Q3
9
2 882 
20
1 907 
2015 Q2
3
2 423 
13
1 790 
2015 Q1
5
2 519 
14
2 108 
2014 Q4
5
2 857 
13
1 712 
2014 Q3
7
2 275 
14
1 928 
2014 Q2
6
2 698 
18
1 777 
2014 Q1
2
2 638 
15
2 000 

Overview of the latest real estate transactions

The following list is an anonymized overview of the latest transactions. For more details and to find all transactions, please use the map to view transactions by plot or the transaction search page for a search by criteria.

2025-06-10
215 000 
2 263  /m²(95 m²)
Sale
Houses
House
6 rooms
95 m2
Land
119 m2
-Sols
1 outbuilding
2025-05-28
300 000 
2 000  /m²(150 m²)
Sale
Apartments
Apartment
3 rooms
75 m2
Apartments
Apartment
3 rooms
75 m2
Land
560 m2
-Sols
2025-05-27
91 260 
2 226  /m²(41 m²)
Sale
Apartments
Apartment
1 room
41 m2
1 outbuilding
1 outbuilding
2025-05-02
100 000 
1 887  /m²(53 m²)
Sale
Apartments
Apartment
2 rooms
53 m2
1 outbuilding
1 outbuilding
2025-04-17
142 500 
2 036  /m²(70 m²)
Sale
Apartments
Apartment
4 rooms
70 m2
1 outbuilding
2025-04-15
179 000 
2 557  /m²(70 m²)
Sale
Apartments
Apartment
3 rooms
70 m2
2 outbuildings
2025-04-11
15 000 
Sale
1 outbuilding
2025-04-04
13 000 
Sale
1 outbuilding
2025-03-28
150 500 
1 858  /m²(81 m²)
Sale
Apartments
Apartment
4 rooms
81 m2
1 outbuilding
2025-03-27
20 000 
Sale
1 outbuilding
2025-03-21
133 000 
1 847  /m²(72 m²)
Sale
Apartments
Apartment
4 rooms
72 m2
1 outbuilding
2025-03-19
130 000 
1 806  /m²(72 m²)
Sale
Apartments
Apartment
4 rooms
72 m2
1 outbuilding
2025-03-19
200 000 
2 667  /m²(75 m²)
Sale
1 outbuilding
Houses
House
4 rooms
75 m2
1 outbuilding
Land
107 m2
-Sols
2025-03-04
140 000 
2 258  /m²(62 m²)
Sale
Apartments
Apartment
3 rooms
62 m2
1 outbuilding
2025-03-03
83 000 
1 317  /m²(63 m²)
Sale
Apartments
Apartment
3 rooms
63 m2
1 outbuilding
2025-03-03
225 000 
4 018  /m²(56 m²)
Sale
Houses
House
3 rooms
56 m2
2025-02-28
219 000 
3 085  /m²(71 m²)
Sale
Houses
House
4 rooms
71 m2
Land
170 m2
-Sols
1 outbuilding
2025-02-27
11 000 
Sale
1 outbuilding
2025-02-27
190 000 
2 676  /m²(71 m²)
Sale
Houses
House
4 rooms
71 m2
Land
121 m2
-Sols
2025-02-26
220 000 
2 750  /m²(80 m²)
Sale
Houses
House
4 rooms
80 m2
1396 transactions listed in the municipality

Essonne (91)

Most expensive cities

City
name
Descending orderHouses
house
Price per m²
5 484 
5 052 
4 784 
4 710 
4 491 
4 362 
4 244 
City
name
Descending orderApartments
apt.
Price per m²
5 783 
5 520 
4 708 
4 222 
4 212 
4 198 

Least expensive cities

City
name
Ascending orderHouses
house
Price per m²
1 714 
1 801 
1 833 
1 868 
1 905 
1 914 
1 967 
2 000 
2 095 
City
name
Ascending orderApartments
apt.
Price per m²
1 066 
1 135 
1 194 
1 209 
1 354 
1 719