emooki
HomePrice mapTransactions
🇬🇧 English🇫🇷 Français🇩🇪 Deutsch🇪🇸 Español🇮🇹 Italiano

Real estate price map


Real estate price map in the municipality of Saint-Cyr-la-Rivière, choose a section to see transactions by parcel.

Essonne (91)
Saint-Cyr-la-Rivière

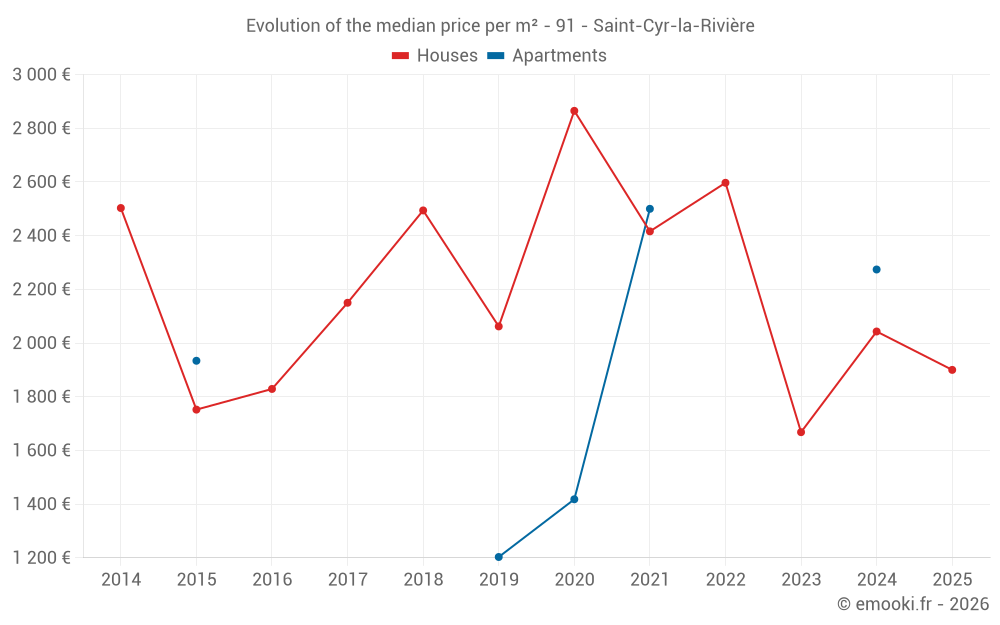
Median price of real estate
in the municipality of Saint-Cyr-la-Rivière

HousesHouses
2 270  /m²
1-23-45-67-89-10
Reliability 6/10
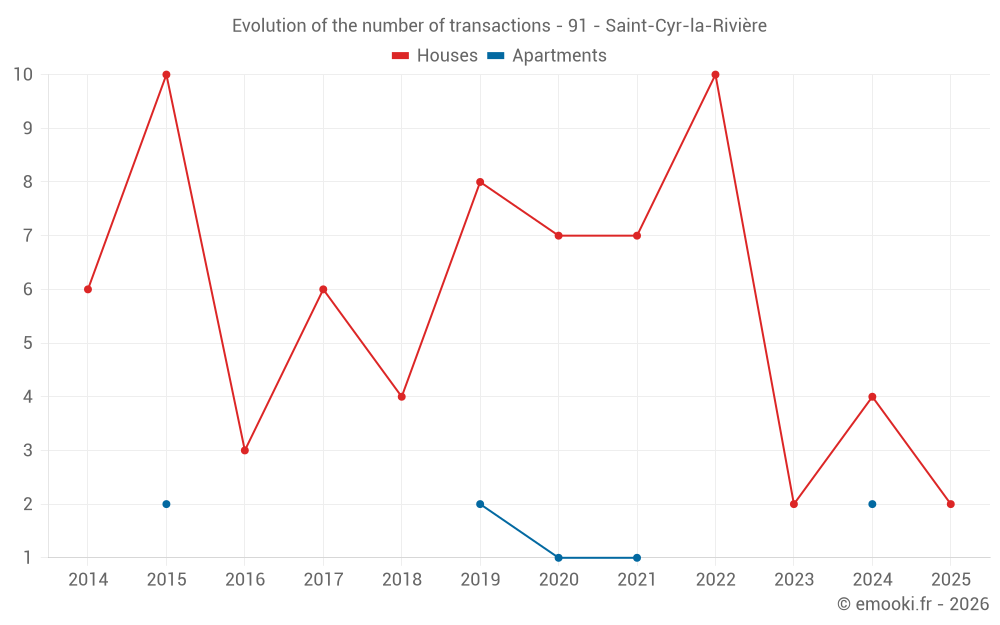
Median price on the 12 transactions of the last 36 months.
from 1 591 to
2 909  /m²
60% of transactions from the 2nd to the 8th deciles.
ApartmentsApartments
1 812  /m²
1-23-45-67-89-10
Reliability 3/10
Median price on the 6 transactions of the last 72 months.
DwellingsDwellings
2 270  /m²
1-23-45-67-89-10
Reliability 6/10
Median price on the 14 transactions of the last 36 months.
from 1 701 to
2 858  /m²
60% of transactions from the 2nd to the 8th deciles.

Yearly evolution

Evolution of the median price per m²

Evolution of the number of transactions

Warning, last year incomplete. Projections made based on the proportions between semesters of the previous year at the departmental/national level and by type of property.

Yearly data

Descending order
Year
Houses
house
transactions
Houses
house
Price per m²
Apartments
apt.
transactions
Apartments
apt.
Price per m²
2025
2
1 900 
0
--- 
2024
4
2 043 
2
2 274 
2023
2
1 668 
0
--- 
2022
10
2 597 
0
--- 
2021
7
2 416 
1
2 500 
2020
7
2 865 
1
1 418 
2019
8
2 062 
2
1 203 
2018
4
2 494 
0
--- 
2017
6
2 150 
0
--- 
2016
3
1 829 
0
--- 
2015
10
1 752 
2
1 934 
2014
6
2 503 
0
--- 

Analysis

Structure of prices per m²

Values of price percentiles per m² over the periods used for the estimated price of each type of property.

Structure of transaction amounts

Values of transaction amounts percentiles over the periods used for the estimated price of each type of property.

Transaction amounts and prices per m² by percentile

Ascending order
Percentile
Houses
house
Price per m²
Houses
house
Transaction amount
Apartments
apt.
Price per m²
Apartments
apt.
Transaction amount
10th percentile
1 514 
167 K
1 058 
104 K
20th percentile
1 591 
181 K
1 418 
115 K
30th percentile
1 815 
219 K
1 563 
118 K
40th percentile
1 890 
256 K
1 708 
120 K
50th percentile
2 270 
278 K
1 812 
121 K
60th percentile
2 681 
302 K
1 917 
121 K
70th percentile
2 796 
322 K
2 208 
163 K
80th percentile
2 909 
354 K
2 500 
205 K
90th percentile
3 507 
378 K
2 565 
218 K

National and departmental comparison

Evolution of the median price per m² of houses

Evolution of the median price per m² of apartments

Quarterly evolution

Evolution of the median price per m²

Evolution of the number of transactions

Quarterly data

Descending order
Quarter
Houses
house
transactions
Houses
house
Price per m²
Apartments
apt.
transactions
Apartments
apt.
Price per m²
2025 Q1
2
1 900 
0
--- 
2024 Q4
2
1 359 
0
--- 
2024 Q3
1
2 550 
2
2 274 
2024 Q1
1
2 807 
0
--- 
2023 Q4
1
1 824 
0
--- 
2023 Q2
1
1 511 
0
--- 
2022 Q4
1
2 934 
0
--- 
2022 Q3
3
3 571 
0
--- 
2022 Q2
3
2 220 
0
--- 
2022 Q1
3
2 255 
0
--- 
2021 Q4
3
2 416 
0
--- 
2021 Q3
2
3 021 
0
--- 
2021 Q2
0
--- 
1
2 500 
2021 Q1
2
1 993 
0
--- 
2020 Q4
3
2 865 
0
--- 
2020 Q3
1
2 538 
1
1 418 
2020 Q2
2
3 066 
0
--- 
2020 Q1
1
2 261 
0
--- 
2019 Q4
5
1 806 
2
1 203 
2019 Q3
1
3 253 
0
--- 
2019 Q2
1
1 939 
0
--- 
2019 Q1
1
2 250 
0
--- 
2018 Q4
1
3 212 
0
--- 
2018 Q2
2
2 230 
0
--- 
2018 Q1
1
2 426 
0
--- 
2017 Q4
1
2 407 
0
--- 
2017 Q3
1
2 276 
0
--- 
2017 Q2
4
2 034 
0
--- 
2016 Q4
1
3 548 
0
--- 
2016 Q3
1
1 360 
0
--- 
2016 Q2
1
1 829 
0
--- 
2015 Q4
4
1 868 
1
1 693 
2015 Q3
3
1 093 
0
--- 
2015 Q2
2
1 925 
1
2 174 
2015 Q1
1
1 647 
0
--- 
2014 Q4
2
2 088 
0
--- 
2014 Q3
3
2 746 
0
--- 
2014 Q1
1
2 946 
0
--- 

Overview of the latest real estate transactions

The following list is an anonymized overview of the latest transactions. For more details and to find all transactions, please use the map to view transactions by plot or the transaction search page for a search by criteria.

2025-03-28
306 000 
1 811  /m²(169 m²)
Sale
Houses
House
7 rooms
169 m2
3 outbuildings
Land
283 m2
-Sols
2025-02-25
388 000 
1 990  /m²(195 m²)
Sale
Houses
House
4 rooms
195 m2
Land
7178 m2
-Terrains d'agrément
Land
1667 m2
-Taillis simples
2024-12-20
260 000 
1 182  /m²(220 m²)
Sale
Houses
House
7 rooms
220 m2
1 outbuilding
Land
921 m2
-Sols
2024-11-05
295 000 
1 536  /m²(192 m²)
Sale
Houses
House
6 rooms
192 m2
Land
1000 m2
-Sols
Land
2112 m2
-Terrains d'agrément
Land
130 m2
-Vergers
Land
17 m2
-Jardins
/Jardin potager
Land
30 m2
-Sols
Land
28 m2
-Sols
Land
530 m2
-Vergers
Land
156 m2
-Taillis simples
/AULN
Land
2430 m2
-Taillis simples
/AULN
2024-09-07
121 000 
2 630  /m²(46 m²)
Sale
Apartments
Apartment
3 rooms
46 m2
2024-08-21
2 000 
Sale
Land
7109 m2
-Taillis simples
2024-08-19
230 000 
1 917  /m²(120 m²)
Sale
Apartments
Apartment
4 rooms
120 m2
3 outbuildings
Land
800 m2
-Sols
2024-08-14
2 100 
Sale
Land
420 m2
-Landes
/Friche
2024-07-30
380 000 
2 550  /m²(149 m²)
Sale
Houses
House
5 rooms
149 m2
Land
400 m2
-Sols
Land
4583 m2
-Taillis simples
2024-01-05
159 975 
2 807  /m²(57 m²)
Sale
Houses
House
4 rooms
57 m2
Land
720 m2
-Sols
2023-12-28
350 000 
Sale
Land
17800 m2
-Taillis simples
/AULN
2023-12-27
2 200 
Sale
Land
1100 m2
-Taillis simples
2023-12-05
146 000 
Sale
Land
1615 m2
-Peupleraies
Land
4075 m2
-Peupleraies
2023-10-26
166 000 
1 824  /m²(91 m²)
Sale
Houses
House
4 rooms
91 m2
1 outbuilding
Land
1000 m2
-Sols
Land
1052 m2
-Terrains d'agrément
Land
15 m2
-Sols
2023-10-03
215 000 
Sale
Land
363 m2
-Sols
Land
266 m2
-Terrains à bâtir
Land
330 m2
-Terrains à bâtir
Land
41 m2
-Sols
Land
610 m2
-Terrains à bâtir
Land
354 m2
-Terrains à bâtir
2023-08-18
460 
Sale
Land
230 m2
-Taillis simples
/AULN
2023-05-06
42 847 
Sale
Land
22500 m2
-Terres
Land
15810 m2
-Terres
Land
1287 m2
-Terres
2023-04-12
204 000 
1 511  /m²(135 m²)
Sale
Houses
House
7 rooms
135 m2
Land
1500 m2
-Terrains d'agrément
Land
500 m2
-Sols
Land
2065 m2
-Terres
Land
489 m2
-Sols
2023-03-23
850 
Sale
Land
1050 m2
-Taillis simples
/AULN
2023-03-09
200 
Sale
Land
66 m2
-Landes
/Friche
130 transactions listed in the municipality

Essonne (91)

Most expensive cities

City
name
Descending orderHouses
house
Price per m²
5 484 
5 052 
4 784 
4 710 
4 491 
4 362 
4 244 
City
name
Descending orderApartments
apt.
Price per m²
5 783 
5 520 
4 708 
4 222 
4 212 
4 198 

Least expensive cities

City
name
Ascending orderHouses
house
Price per m²
1 714 
1 801 
1 833 
1 868 
1 905 
1 914 
1 967 
2 000 
2 095 
City
name
Ascending orderApartments
apt.
Price per m²
1 066 
1 135 
1 194 
1 209 
1 354 
1 719