emooki
HomePrice mapTransactions
🇬🇧 English🇫🇷 Français🇩🇪 Deutsch🇪🇸 Español🇮🇹 Italiano

Real estate price map


Real estate price map in the municipality of Saint-Jean-de-Monts, choose a section to see transactions by parcel.

Vendée (85)

Saint-Jean-de-Monts - Real estate price m²

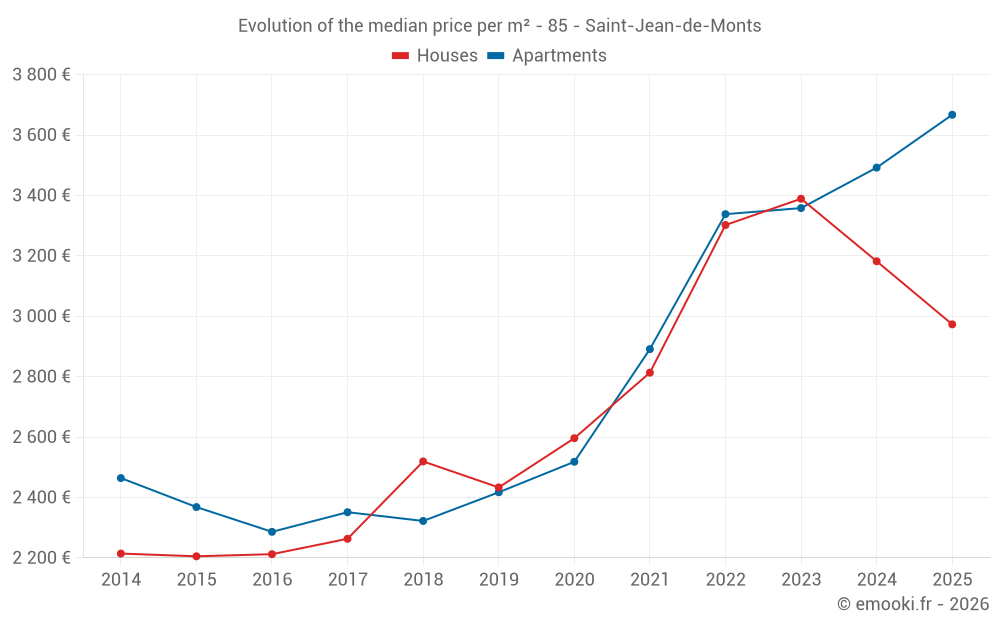
Median price of real estate
in the municipality of Saint-Jean-de-Monts

HousesHouses
2 832  /m²
1-23-45-67-89-10
Reliability 10/10
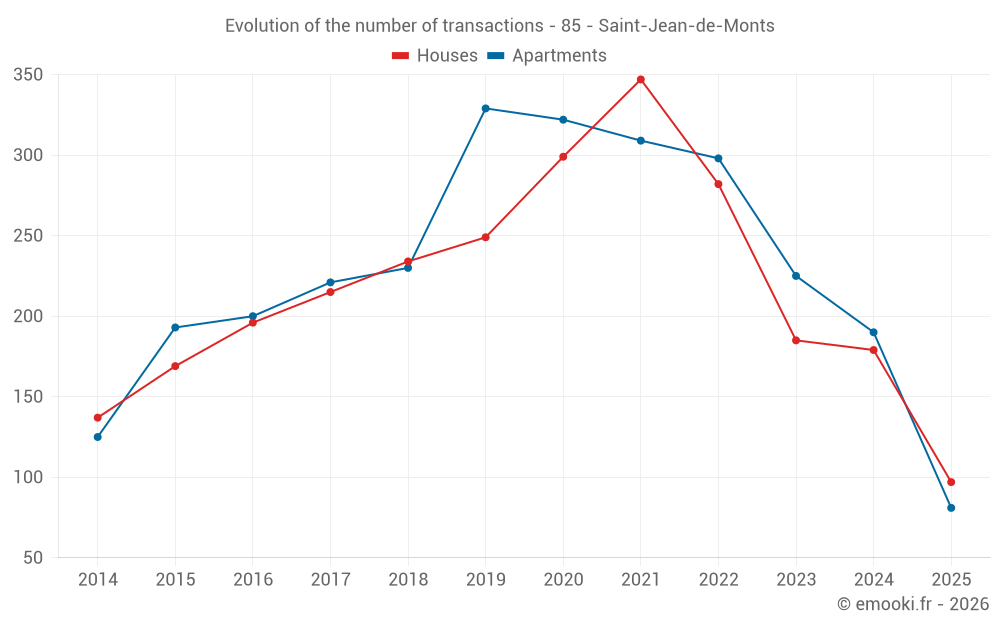
Median price on the 45 transactions of the last 3 months.
from 1 871 to
3 745  /m²
60% of transactions from the 2nd to the 8th deciles.
ApartmentsApartments
3 670  /m²
1-23-45-67-89-10
Reliability 10/10
Median price on the 38 transactions of the last 3 months.
from 2 962 to
4 439  /m²
60% of transactions from the 2nd to the 8th deciles.
DwellingsDwellings
3 321  /m²
1-23-45-67-89-10
Reliability 10/10
Median price on the 83 transactions of the last 3 months.
from 2 120 to
4 112  /m²
60% of transactions from the 2nd to the 8th deciles.
HousesEvolution of the price per m² of houses since...
1 year
-6.6%
2 years
-12%
3 years
-10%
4 years
+5.7%
5 years
+15%
6 years
+22%
7 years
+18%
8 years
+31%
9 years
+34%
10 years
+35%
11 years
+34%
The price per m² of houses has decreased by 12% since 2 years, but it has increased by 35% in 10 years.
ApartmentsEvolution of the price per m² of apartments since...
1 year
+5%
2 years
+9.2%
3 years
+10%
4 years
+27%
5 years
+46%
6 years
+52%
7 years
+58%
8 years
+56%
9 years
+60%
10 years
+55%
11 years
+49%

Yearly evolution

Evolution of the median price per m²

Evolution of the median price per m² - 85 - Saint-Jean-de-Monts

Evolution of the number of transactions

Warning, last year incomplete. Projections made based on the proportions between semesters of the previous year at the departmental/national level and by type of property.

Evolution of the number of transactions - 85 - Saint-Jean-de-Monts

Yearly data

Descending order
Year
Houses
house
transactions
Houses
house
Price per m²
Apartments
apt.
transactions
Apartments
apt.
Price per m²
2025
97
2 973 
81
3 667 
2024
179
3 182 
190
3 492 
2023
185
3 389 
225
3 358 
2022
282
3 302 
298
3 338 
2021
347
2 813 
309
2 891 
2020
299
2 596 
322
2 518 
2019
249
2 433 
329
2 417 
2018
234
2 519 
230
2 322 
2017
215
2 263 
221
2 351 
2016
196
2 212 
200
2 286 
2015
169
2 205 
193
2 368 
2014
137
2 214 
125
2 464 

Analysis

Structure of prices per m²

Values of price percentiles per m² over the periods used for the estimated price of each type of property.

Structure of transaction amounts

Values of transaction amounts percentiles over the periods used for the estimated price of each type of property.

Transaction amounts and prices per m² by percentile

Ascending order
Percentile
Houses
house
Price per m²
Houses
house
Transaction amount
Apartments
apt.
Price per m²
Apartments
apt.
Transaction amount
10th percentile
1 468 
127 K
2 617 
78 296 
20th percentile
1 871 
148 K
2 962 
86 508 
30th percentile
2 030 
181 K
3 127 
94 040 
40th percentile
2 479 
220 K
3 373 
114 K
50th percentile
2 832 
235 K
3 670 
129 K
60th percentile
3 178 
250 K
3 917 
158 K
70th percentile
3 452 
313 K
4 003 
180 K
80th percentile
3 745 
344 K
4 439 
212 K
90th percentile
4 265 
402 K
4 745 
262 K

National and departmental comparison

Evolution of the median price per m² of houses

Evolution of the median price per m² of apartments

Quarterly evolution

Evolution of the median price per m²

Evolution of the number of transactions

Quarterly data

Descending order
Quarter
Houses
house
transactions
Houses
house
Price per m²
Apartments
apt.
transactions
Apartments
apt.
Price per m²
2025 Q2
45
2 832 
38
3 670 
2025 Q1
52
3 130 
43
3 667 
2024 Q4
53
3 258 
51
3 406 
2024 Q3
37
3 182 
44
3 544 
2024 Q2
54
2 995 
53
3 692 
2024 Q1
35
3 333 
42
3 378 
2023 Q4
38
3 282 
59
3 333 
2023 Q3
44
3 638 
61
3 289 
2023 Q2
55
3 281 
56
3 574 
2023 Q1
48
3 317 
49
3 379 
2022 Q4
58
3 462 
67
3 611 
2022 Q3
76
3 492 
60
3 334 
2022 Q2
68
3 154 
93
3 289 
2022 Q1
80
3 095 
78
3 113 
2021 Q4
87
3 103 
73
3 159 
2021 Q3
99
2 821 
79
2 964 
2021 Q2
90
2 778 
89
2 771 
2021 Q1
71
2 568 
68
2 614 
2020 Q4
104
2 690 
114
2 774 
2020 Q3
72
2 548 
64
2 425 
2020 Q2
56
2 406 
74
2 374 
2020 Q1
67
2 429 
70
2 450 
2019 Q4
74
2 424 
83
2 380 
2019 Q3
68
2 524 
93
2 543 
2019 Q2
56
2 396 
68
2 514 
2019 Q1
51
2 286 
85
2 191 
2018 Q4
74
2 498 
56
2 128 
2018 Q3
60
2 464 
60
2 128 
2018 Q2
46
2 694 
60
2 322 
2018 Q1
54
2 475 
54
2 510 
2017 Q4
59
2 353 
46
2 236 
2017 Q3
54
2 289 
52
2 548 
2017 Q2
54
2 260 
66
2 321 
2017 Q1
48
2 017 
57
2 381 
2016 Q4
60
2 060 
60
2 405 
2016 Q3
46
2 198 
53
2 250 
2016 Q2
53
2 397 
41
2 150 
2016 Q1
37
2 052 
46
2 504 
2015 Q4
58
2 129 
58
2 436 
2015 Q3
47
2 119 
48
2 396 
2015 Q2
37
2 260 
51
2 333 
2015 Q1
27
2 273 
36
2 259 
2014 Q4
30
2 431 
30
2 239 
2014 Q3
38
1 950 
38
2 669 
2014 Q2
27
1 944 
33
2 521 
2014 Q1
42
2 408 
24
2 420 

Overview of the latest real estate transactions

The following list is an anonymized overview of the latest transactions. For more details and to find all transactions, please use the map to view transactions by plot or the transaction search page for a search by criteria.

2025-06-30
381 000 
3 432  /m²(111 m²)
Sale
Houses
House
4 rooms
111 m2
Land
1002 m2
-Sols
2025-06-30
202 600 
3 896  /m²(52 m²)
Sale
Houses
House
2 rooms
52 m2
Land
207 m2
-Sols
1 outbuilding
Land
21 m2
-Sols
Commercial property
Land
10753 m2
-Sols
Land
54 m2
-Sols
2025-06-28
208 600 
2 483  /m²(84 m²)
Sale
Houses
House
4 rooms
84 m2
2025-06-27
235 000 
1 679  /m²(140 m²)
Sale
Houses
House
6 rooms
95 m2
Houses
House
2 rooms
45 m2
1 outbuilding
Land
839 m2
-Sols
2025-06-27
236 000 
2 088  /m²(113 m²)
Sale
Houses
House
7 rooms
113 m2
Land
1276 m2
-Sols
Land
1303 m2
-Terrains à bâtir
2025-06-27
1 700 
Sale
Land
13600 m2
-Prés
2025-06-26
100 000 
Sale
Land
437 m2
-Terrains à bâtir
2025-06-24
120 600 
1 723  /m²(70 m²)
Sale
Apartments
Apartment
1 room
30 m2
Apartments
Apartment
2 rooms
40 m2
Land
215 m2
-Sols
2025-06-24
117 700 
2 943  /m²(40 m²)
Sale
Apartments
Apartment
2 rooms
40 m2
1 outbuilding
2025-06-24
160 000 
2 000  /m²(80 m²)
Sale
Houses
House
3 rooms
80 m2
1 outbuilding
Land
416 m2
-Sols
2025-06-20
156 285 
2 605  /m²(60 m²)
Sale
Apartments
Apartment
2 rooms
60 m2
1 outbuilding
2025-06-20
116 000 
4 833  /m²(24 m²)
Sale
1 outbuilding
Apartments
Apartment
1 room
24 m2
2 outbuildings
2025-06-19
298 880 
3 321  /m²(90 m²)
Sale
Apartments
Apartment
2 rooms
45 m2
Apartments
Apartment
2 rooms
45 m2
1 outbuilding
Land
550 m2
-Sols
2025-06-19
223 000 
3 484  /m²(64 m²)
Sale
Apartments
Apartment
3 rooms
64 m2
1 outbuilding
1 outbuilding
2025-06-19
570 000 
Sale
Land
433 m2
-Sols
2025-06-18
410 000 
2 662  /m²(154 m²)
Sale
1 outbuilding
Land
317 m2
-Sols
Houses
House
3 rooms
58 m2
Land
268 m2
-Sols
Apartments
Apartment
1 room
36 m2
Apartments
Apartment
3 rooms
60 m2
Land
240 m2
-Sols
Land
371 m2
-Sols
Land
20 m2
-Sols
2025-06-18
440 000 
3 235  /m²(136 m²)
Sale
Land
1349 m2
-Sols
Houses
House
4 rooms
136 m2
1 outbuilding
Land
568 m2
-Sols
2025-06-13
270 000 
3 375  /m²(80 m²)
Sale
Apartments
Apartment
4 rooms
80 m2
1 outbuilding
2025-06-11
113 800 
4 552  /m²(25 m²)
Sale
Apartments
Apartment
1 room
25 m2
1 outbuilding
2025-06-06
212 400 
2 167  /m²(98 m²)
Sale
Houses
House
3 rooms
70 m2
Houses
House
1 room
28 m2
Land
535 m2
-Sols
Land
47 m2
-Sols
8566 transactions listed in the municipality

Vendée (85)

Most expensive cities

City
name
Descending orderHouses
house
Price per m²
5 492 
4 318 
4 081 
3 519 
City
name
Descending orderApartments
apt.
Price per m²
4 460 
3 966 
3 694 

Least expensive cities

City
name
Ascending orderHouses
house
Price per m²
667 
1 000 
1 060 
City
name
Ascending orderApartments
apt.
Price per m²
190 
225 
287 
343 
469 
491