emooki
HomePrice mapTransactions
🇬🇧 English🇫🇷 Français🇩🇪 Deutsch🇪🇸 Español🇮🇹 Italiano

Real estate price map


Real estate price map in the municipality of Piolenc, choose a section to see transactions by parcel.

Vaucluse (84)

Piolenc - Real estate price m²

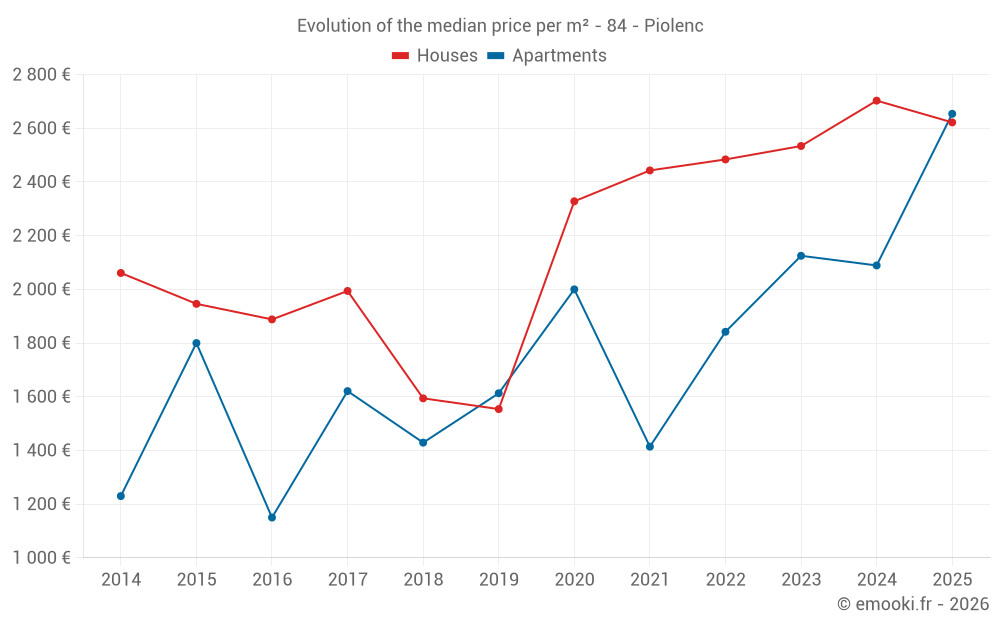
Median price of real estate
in the municipality of Piolenc

HousesHouses
2 831  /m²
1-23-45-67-89-10
Reliability 8/10
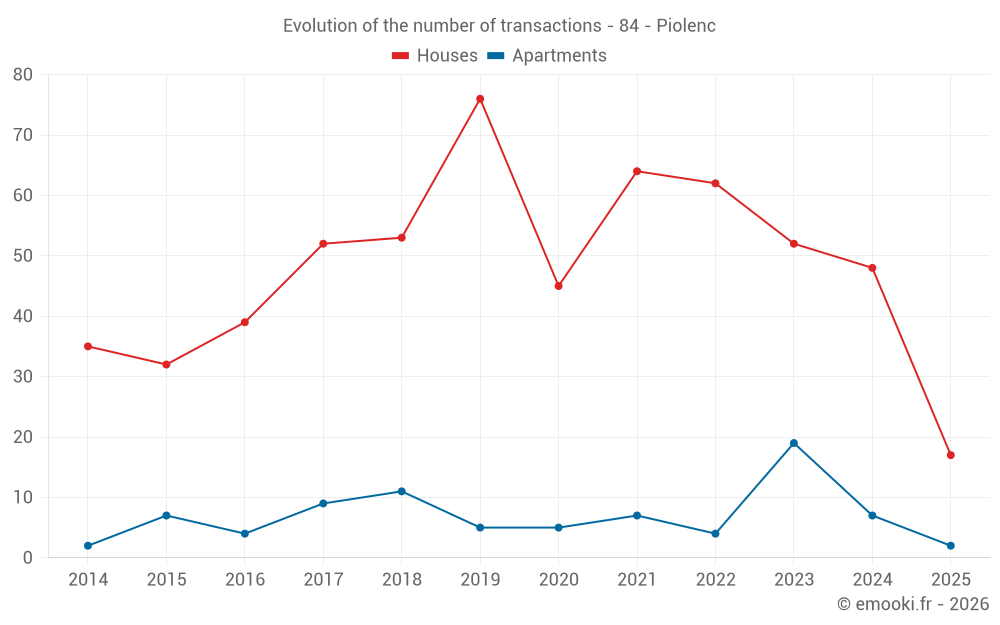
Median price on the 47 transactions of the last 12 months.
from 2 400 to
3 250  /m²
60% of transactions from the 2nd to the 8th deciles.
ApartmentsApartments
2 220  /m²
1-23-45-67-89-10
Reliability 7/10
Median price on the 22 transactions of the last 24 months.
from 2 061 to
2 508  /m²
60% of transactions from the 2nd to the 8th deciles.
DwellingsDwellings
2 622  /m²
1-23-45-67-89-10
Reliability 9/10
Median price on the 19 transactions of the last 6 months.
from 2 449 to
2 967  /m²
60% of transactions from the 2nd to the 8th deciles.
HousesEvolution of the price per m² of houses since...
1 year
-3%
2 years
+3.5%
3 years
+5.6%
4 years
+7.3%
5 years
+13%
6 years
+69%
7 years
+64%
8 years
+31%
9 years
+39%
10 years
+35%
11 years
+27%
The price per m² of houses has decreased by 3% since 1 year, but it has increased by 69% in 6 years.

Yearly evolution

Evolution of the median price per m²

Evolution of the median price per m² - 84 - Piolenc

Evolution of the number of transactions

Warning, last year incomplete. Projections made based on the proportions between semesters of the previous year at the departmental/national level and by type of property.

Evolution of the number of transactions - 84 - Piolenc

Yearly data

Descending order
Year
Houses
house
transactions
Houses
house
Price per m²
Apartments
apt.
transactions
Apartments
apt.
Price per m²
2025
17
2 622 
2
2 654 
2024
48
2 703 
7
2 089 
2023
52
2 534 
19
2 125 
2022
62
2 484 
4
1 842 
2021
64
2 443 
7
1 414 
2020
45
2 328 
5
2 000 
2019
76
1 554 
5
1 613 
2018
53
1 594 
11
1 429 
2017
52
1 994 
9
1 621 
2016
39
1 888 
4
1 150 
2015
32
1 946 
7
1 800 
2014
35
2 061 
2
1 230 

Analysis

Structure of prices per m²

Values of price percentiles per m² over the periods used for the estimated price of each type of property.

Structure of transaction amounts

Values of transaction amounts percentiles over the periods used for the estimated price of each type of property.

Transaction amounts and prices per m² by percentile

Ascending order
Percentile
Houses
house
Price per m²
Houses
house
Transaction amount
Apartments
apt.
Price per m²
Apartments
apt.
Transaction amount
10th percentile
2 111 
191 K
1 865 
99 900 
20th percentile
2 400 
204 K
2 061 
111 K
30th percentile
2 526 
223 K
2 124 
112 K
40th percentile
2 720 
235 K
2 175 
121 K
50th percentile
2 831 
255 K
2 220 
140 K
60th percentile
2 961 
278 K
2 448 
148 K
70th percentile
3 051 
306 K
2 483 
153 K
80th percentile
3 250 
344 K
2 508 
211 K
90th percentile
3 595 
382 K
2 534 
231 K

National and departmental comparison

Evolution of the median price per m² of houses

Evolution of the median price per m² of apartments

Quarterly evolution

Evolution of the median price per m²

Evolution of the number of transactions

Quarterly data

Descending order
Quarter
Houses
house
transactions
Houses
house
Price per m²
Apartments
apt.
transactions
Apartments
apt.
Price per m²
2025 Q2
4
3 192 
1
2 816 
2025 Q1
13
2 591 
1
2 491 
2024 Q4
13
2 688 
2
1 753 
2024 Q3
17
2 989 
1
2 441 
2024 Q2
10
2 106 
2
1 902 
2024 Q1
8
2 491 
2
2 676 
2023 Q4
17
2 688 
11
2 220 
2023 Q3
13
2 614 
2
2 235 
2023 Q2
8
2 900 
2
1 896 
2023 Q1
14
2 252 
4
1 348 
2022 Q4
11
2 518 
0
--- 
2022 Q3
19
2 517 
0
--- 
2022 Q2
22
2 344 
1
6 082 
2022 Q1
10
2 236 
3
1 825 
2021 Q4
15
2 595 
2
1 394 
2021 Q3
27
2 516 
4
1 396 
2021 Q2
14
2 438 
1
1 953 
2021 Q1
8
2 142 
0
--- 
2020 Q4
14
2 524 
2
1 692 
2020 Q3
10
2 307 
1
2 000 
2020 Q2
12
2 116 
2
1 562 
2020 Q1
9
2 079 
0
--- 
2019 Q4
18
1 994 
0
--- 
2019 Q3
19
1 721 
5
1 613 
2019 Q2
14
2 249 
0
--- 
2019 Q1
25
925 
0
--- 
2018 Q4
18
1 471 
2
1 514 
2018 Q3
13
2 013 
3
2 000 
2018 Q2
13
1 752 
4
1 373 
2018 Q1
9
1 556 
2
714 
2017 Q4
19
1 429 
3
1 621 
2017 Q3
11
2 102 
1
905 
2017 Q2
14
2 158 
3
1 699 
2017 Q1
8
1 662 
2
1 816 
2016 Q4
8
2 034 
1
1 236 
2016 Q3
15
1 865 
1
658 
2016 Q2
6
1 804 
1
1 142 
2016 Q1
10
2 026 
1
1 158 
2015 Q4
9
1 956 
0
--- 
2015 Q3
15
1 845 
3
1 544 
2015 Q2
3
1 950 
1
2 170 
2015 Q1
5
1 939 
3
1 800 
2014 Q4
10
2 084 
0
--- 
2014 Q3
3
1 212 
0
--- 
2014 Q2
15
2 123 
0
--- 
2014 Q1
7
1 463 
2
1 230 

Overview of the latest real estate transactions

The following list is an anonymized overview of the latest transactions. For more details and to find all transactions, please use the map to view transactions by plot or the transaction search page for a search by criteria.

2025-06-11
245 000 
3 451  /m²(71 m²)
Sale
Houses
House
4 rooms
71 m2
Land
892 m2
-Jardins
Land
500 m2
-Sols
2025-05-14
50 000 
235  /m²(213 m²)
Sale
Commercial property
171 m2
Commercial property
42 m2
2025-05-07
8 000 
Sale
Land
2317 m2
-Vignes
2025-04-30
240 870 
Sale
Land
465 m2
-Vignes
Land
9 m2
-Vignes
Land
1223 m2
-Vergers
Land
30 m2
-Vergers
Land
2389 m2
-Bois
2025-04-28
228 000 
2 426  /m²(94 m²)
Sale
Houses
House
4 rooms
94 m2
1 outbuilding
2025-04-25
305 000 
2 933  /m²(104 m²)
Sale
Houses
House
5 rooms
104 m2
2 outbuildings
Land
600 m2
-Sols
2025-04-22
290 000 
2 816  /m²(103 m²)
Sale
Apartments
Apartment
1 room
22 m2
Apartments
Apartment
4 rooms
81 m2
3 outbuildings
Land
857 m2
-Jardins
Land
500 m2
-Sols
2025-04-17
1 000 
Sale
Commercial property
Land
22 m2
-Terrains à bâtir
Land
2483 m2
-Sols
Land
1100 m2
-Terrains à bâtir
Land
227 m2
-Sols
Land
245 m2
-Terrains à bâtir
Land
1319 m2
-Terrains à bâtir
Land
36 m2
-Terrains à bâtir
Land
30 m2
-Terrains à bâtir
2025-04-16
634 800 
3 527  /m²(180 m²)
Sale
Land
4330 m2
-Vergers
Houses
House
6 rooms
180 m2
3 outbuildings
Land
500 m2
-Sols
Land
875 m2
-Jardins
Land
493 m2
-Vergers
Land
8 m2
-Vergers
Land
1000 m2
-Vergers
2025-04-15
21 795 
Sale
Land
3797 m2
-Vignes
Land
7101 m2
-Vignes
2025-03-31
380 000 
2 533  /m²(150 m²)
Sale
Houses
House
4 rooms
150 m2
1 outbuilding
Land
693 m2
-Jardins
Land
500 m2
-Sols
Land
173 m2
-Jardins
2025-03-28
225 000 
2 500  /m²(90 m²)
Sale
Land
252 m2
-Sols
Houses
House
4 rooms
90 m2
Land
824 m2
-Sols
Land
260 m2
-Sols
2025-03-27
132 000 
2 491  /m²(53 m²)
Sale
Apartments
Apartment
2 rooms
53 m2
2 outbuildings
2025-03-27
9 192 
Sale
Land
6128 m2
-Terres
2025-03-24
1 000 
Sale
Land
851 m2
-Bois
2025-03-21
203 000 
2 900  /m²(70 m²)
Sale
Houses
House
3 rooms
70 m2
Land
1186 m2
-Sols
2025-03-20
108 000 
Sale
Land
675 m2
-Terrains à bâtir
2025-03-18
210 000 
2 386  /m²(88 m²)
Sale
Houses
House
4 rooms
88 m2
Land
526 m2
-Sols
Commercial property
Land
3025 m2
-Sols
2025-03-17
347 100 
2 799  /m²(124 m²)
Sale
Houses
House
4 rooms
124 m2
3 outbuildings
Land
727 m2
-Sols
2025-03-17
236 000 
2 622  /m²(90 m²)
Sale
Houses
House
3 rooms
90 m2
2 outbuildings
Land
522 m2
-Sols
1402 transactions listed in the municipality

Vaucluse (84)

Most expensive cities

City
name
Descending orderHouses
house
Price per m²
6 530 
5 858 
5 508 
5 477 
5 297 
5 055 
5 000 
4 793 
4 691 
City
name
Descending orderApartments
apt.
Price per m²
4 566 
4 536 
3 739 
3 696 
3 693 
3 580 
3 536 

Least expensive cities

City
name
Ascending orderHouses
house
Price per m²
1 333 
1 706 
1 790 
1 835 
2 000 
2 025 
2 066 
City
name
Ascending orderApartments
apt.
Price per m²
588 
1 000 
1 081 
1 136 
1 150 
1 226 
1 228 
1 230 
1 254