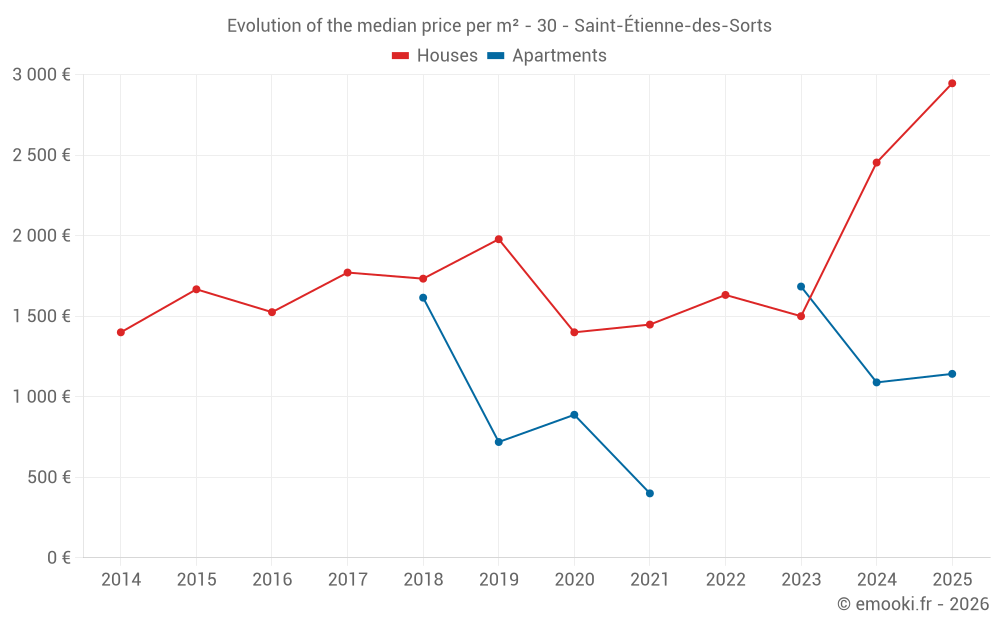
Median price of real estate
in the municipality of Saint-Étienne-des-Sorts
Houses
1 881 € /m²
Reliability 6/10
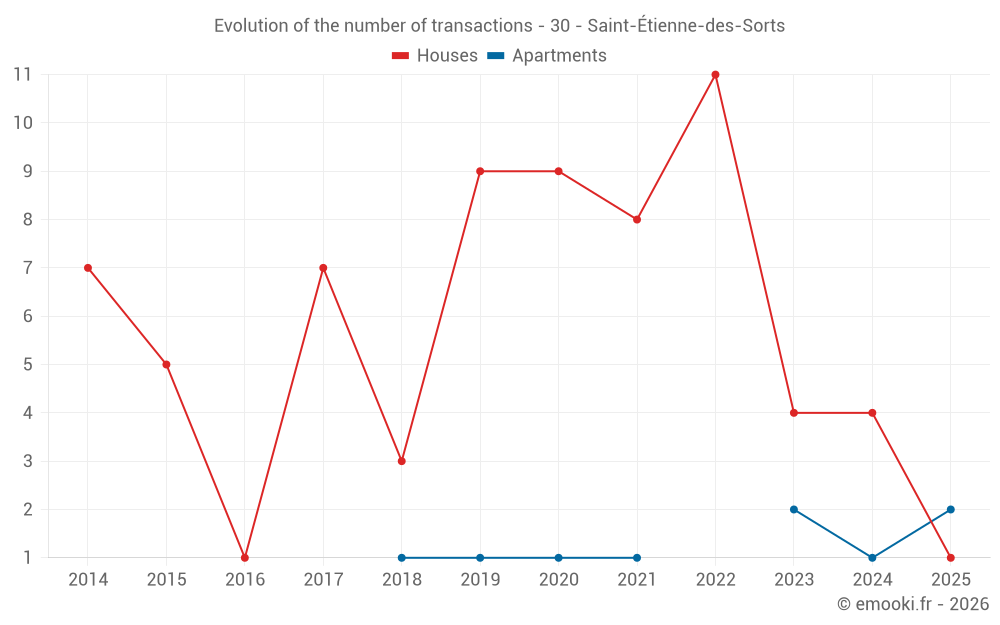
Median price on the 16 transactions of the last 36 months.
from 1 169 to
2 603 € /m²
2 603 € /m²
60% of transactions from the 2nd to the 8th deciles.
Apartments
1 091 € /m²
Reliability 3/10
Median price on the 8 transactions of the last 72 months.
Dwellings
1 632 € /m²
Reliability 6/10
Median price on the 21 transactions of the last 36 months.
from 1 095 to
2 304 € /m²
2 304 € /m²
60% of transactions from the 2nd to the 8th deciles.