emooki
HomePrice mapTransactions
🇬🇧 English🇫🇷 Français🇩🇪 Deutsch🇪🇸 Español🇮🇹 Italiano

Real estate price map


Real estate price map in the municipality of Caderousse, choose a section to see transactions by parcel.

Vaucluse (84)

Caderousse - Real estate price m²

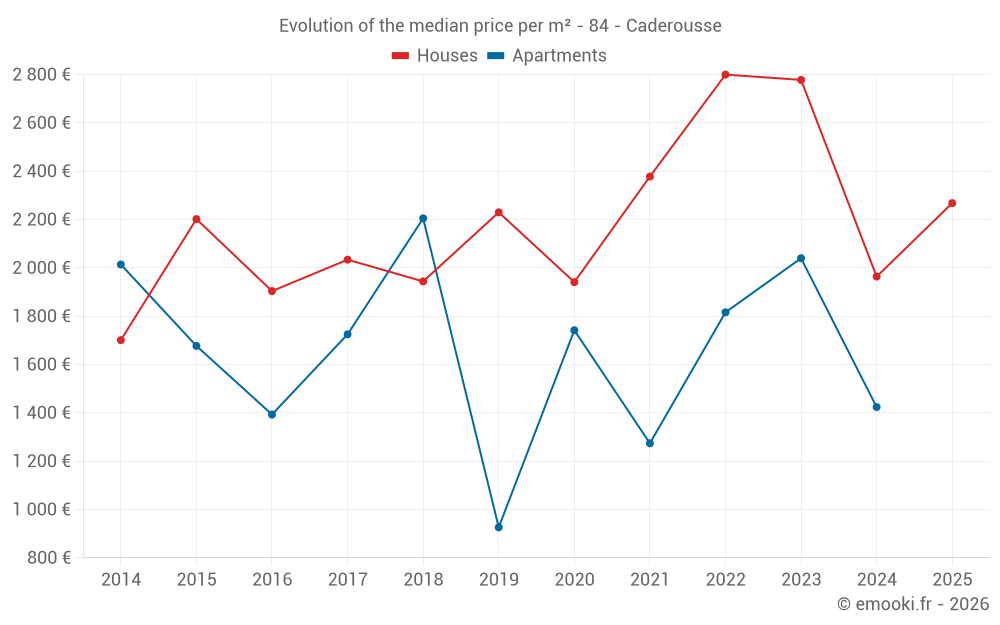
Median price of real estate
in the municipality of Caderousse

HousesHouses
2 259  /m²
1-23-45-67-89-10
Reliability 7/10
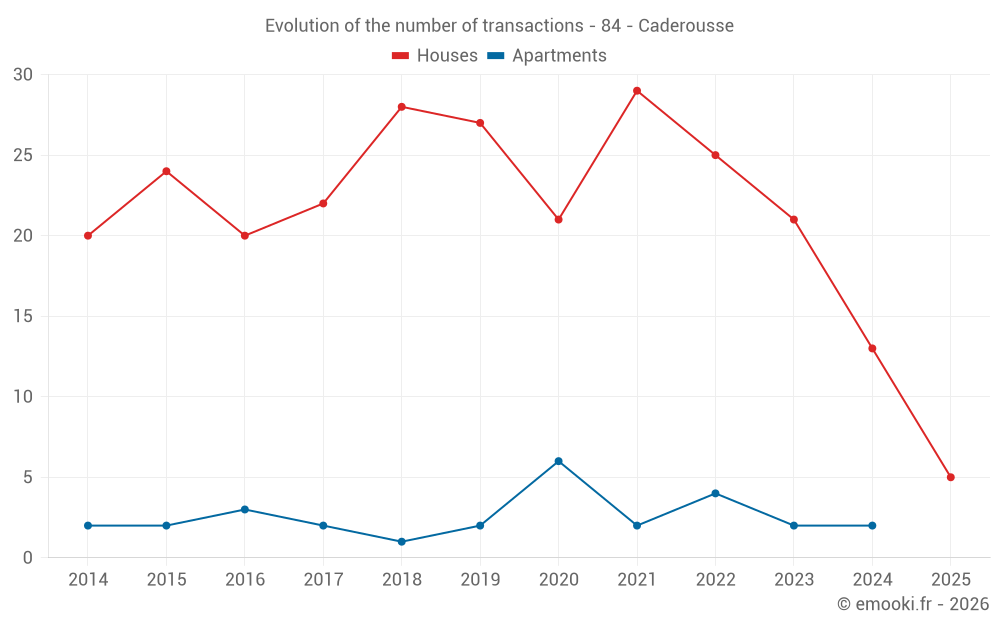
Median price on the 26 transactions of the last 24 months.
from 1 522 to
2 892  /m²
60% of transactions from the 2nd to the 8th deciles.
ApartmentsApartments
1 541  /m²
1-23-45-67-89-10
Reliability 4/10
Median price on the 15 transactions of the last 60 months.
from 1 097 to
2 292  /m²
60% of transactions from the 2nd to the 8th deciles.
DwellingsDwellings
2 188  /m²
1-23-45-67-89-10
Reliability 7/10
Median price on the 29 transactions of the last 24 months.
from 1 438 to
2 824  /m²
60% of transactions from the 2nd to the 8th deciles.
HousesEvolution of the price per m² of houses since...
1 year
+15%
2 years
-18%
3 years
-19%
4 years
-4.6%
5 years
+17%
6 years
+1.7%
7 years
+17%
8 years
+12%
9 years
+19%
10 years
+3%
11 years
+33%
The price per m² of houses has decreased by 19% since 3 years, but it has increased by 33% in 11 years.

Yearly evolution

Evolution of the median price per m²

Evolution of the median price per m² - 84 - Caderousse

Evolution of the number of transactions

Warning, last year incomplete. Projections made based on the proportions between semesters of the previous year at the departmental/national level and by type of property.

Evolution of the number of transactions - 84 - Caderousse

Yearly data

Descending order
Year
Houses
house
transactions
Houses
house
Price per m²
Apartments
apt.
transactions
Apartments
apt.
Price per m²
2025
5
2 268 
0
--- 
2024
13
1 964 
2
1 424 
2023
21
2 778 
2
2 040 
2022
25
2 800 
4
1 816 
2021
29
2 378 
2
1 274 
2020
21
1 941 
6
1 742 
2019
27
2 230 
2
926 
2018
28
1 944 
1
2 205 
2017
22
2 034 
2
1 725 
2016
20
1 904 
3
1 393 
2015
24
2 202 
2
1 677 
2014
20
1 701 
2
2 014 

Analysis

Structure of prices per m²

Values of price percentiles per m² over the periods used for the estimated price of each type of property.

Structure of transaction amounts

Values of transaction amounts percentiles over the periods used for the estimated price of each type of property.

Transaction amounts and prices per m² by percentile

Ascending order
Percentile
Houses
house
Price per m²
Houses
house
Transaction amount
Apartments
apt.
Price per m²
Apartments
apt.
Transaction amount
10th percentile
1 272 
92 500 
1 014 
71 000 
20th percentile
1 522 
108 K
1 097 
99 580 
30th percentile
1 621 
138 K
1 217 
118 K
40th percentile
2 184 
175 K
1 463 
133 K
50th percentile
2 259 
182 K
1 541 
135 K
60th percentile
2 344 
210 K
1 820 
161 K
70th percentile
2 608 
304 K
2 107 
177 K
80th percentile
2 892 
336 K
2 292 
227 K
90th percentile
3 090 
586 K
2 597 
440 K

National and departmental comparison

Evolution of the median price per m² of houses

Evolution of the median price per m² of apartments

Quarterly evolution

Evolution of the median price per m²

Evolution of the number of transactions

Quarterly data

Descending order
Quarter
Houses
house
transactions
Houses
house
Price per m²
Apartments
apt.
transactions
Apartments
apt.
Price per m²
2025 Q2
3
2 268 
0
--- 
2025 Q1
2
1 778 
0
--- 
2024 Q4
4
2 011 
0
--- 
2024 Q3
3
2 184 
0
--- 
2024 Q2
5
1 964 
0
--- 
2024 Q1
1
526 
2
1 424 
2023 Q4
4
2 835 
1
1 392 
2023 Q3
4
2 266 
0
--- 
2023 Q2
5
3 119 
1
2 689 
2023 Q1
8
2 700 
0
--- 
2022 Q4
4
3 234 
1
2 778 
2022 Q3
7
2 967 
0
--- 
2022 Q2
7
2 800 
2
1 086 
2022 Q1
7
2 160 
1
2 460 
2021 Q4
9
2 378 
0
--- 
2021 Q3
7
2 935 
1
1 036 
2021 Q2
4
1 653 
0
--- 
2021 Q1
9
2 375 
1
1 511 
2020 Q4
7
2 162 
4
1 844 
2020 Q3
8
1 396 
1
1 944 
2020 Q2
5
1 528 
0
--- 
2020 Q1
1
2 375 
1
1 514 
2019 Q4
3
2 263 
1
411 
2019 Q3
13
2 137 
1
1 440 
2019 Q2
3
1 373 
0
--- 
2019 Q1
8
2 446 
0
--- 
2018 Q4
6
1 495 
0
--- 
2018 Q3
6
1 970 
1
2 205 
2018 Q2
9
1 897 
0
--- 
2018 Q1
7
2 196 
0
--- 
2017 Q4
9
2 128 
0
--- 
2017 Q3
6
1 793 
0
--- 
2017 Q2
1
2 312 
0
--- 
2017 Q1
6
1 692 
2
1 725 
2016 Q4
6
1 763 
3
1 393 
2016 Q3
6
1 574 
0
--- 
2016 Q2
5
2 042 
0
--- 
2016 Q1
3
2 175 
0
--- 
2015 Q4
6
2 164 
1
1 485 
2015 Q3
9
2 257 
0
--- 
2015 Q2
5
2 336 
1
1 869 
2015 Q1
4
1 764 
0
--- 
2014 Q4
3
1 970 
0
--- 
2014 Q3
7
2 167 
2
2 014 
2014 Q2
6
1 478 
0
--- 
2014 Q1
4
1 546 
0
--- 

Overview of the latest real estate transactions

The following list is an anonymized overview of the latest transactions. For more details and to find all transactions, please use the map to view transactions by plot or the transaction search page for a search by criteria.

2025-06-26
145 000 
1 115  /m²(130 m²)
1 706  /m²(85 m²)
Sale
Houses
House
2 rooms
85 m2
Commercial property
45 m2
Land
228 m2
-Sols
2025-05-22
360 000 
2 250  /m²(160 m²)
Sale
Houses
House
4 rooms
160 m2
Land
313 m2
-Sols
Land
950 m2
-Terres
2025-04-30
335 700 
2 268  /m²(148 m²)
Sale
Houses
House
1 room
18 m2
1 outbuilding
Land
285 m2
-Jardins
Houses
House
4 rooms
130 m2
Land
365 m2
-Sols
2025-04-30
764 400 
2 268  /m²(337 m²)
Sale
Houses
House
11 rooms
337 m2
1 outbuilding
Land
1500 m2
-Sols
Land
9679 m2
-Terres
2025-04-24
8 600 
Sale
Land
2930 m2
-Terres
2025-04-09
10 600 
Sale
Land
3059 m2
-Terres
Land
7500 m2
-Terres
2025-04-01
17 067 
Sale
Land
2514 m2
-Terres
Land
12220 m2
-Terres
Land
1184 m2
-Terres
Land
1133 m2
-Terres
2025-03-12
280 000 
1 273  /m²(220 m²)
3 500  /m²(80 m²)
Sale
Houses
House
3 rooms
80 m2
Commercial property
140 m2
Land
241 m2
-Sols
2025-02-20
35 000 
583  /m²(60 m²)
Sale
Houses
House
3 rooms
60 m2
Land
100 m2
-Sols
2025-02-19
330 000 
2 973  /m²(111 m²)
Sale
Houses
House
5 rooms
111 m2
2 outbuildings
Land
589 m2
-Sols
2 outbuildings
Land
516 m2
-Jardins
2025-02-07
7 315 
Sale
Land
4401 m2
-Terres
2025-01-17
1 545 
Sale
Land
1030 m2
-Terres
2025-01-10
6 800 
Sale
Land
4940 m2
-Terres
2024-12-27
140 000 
1 346  /m²(104 m²)
Sale
Houses
House
3 rooms
104 m2
2024-12-23
95 000 
2 568  /m²(37 m²)
Sale
Houses
House
1 room
37 m2
2 outbuildings
Land
133 m2
-Sols
2024-12-19
3 035 
Sale
Land
3035 m2
-Terres
2024-12-02
175 000 
1 522  /m²(115 m²)
Sale
Houses
House
4 rooms
115 m2
Land
125 m2
-Sols
2024-11-13
135 000 
2 500  /m²(54 m²)
Sale
Houses
House
3 rooms
54 m2
Land
89 m2
-Sols
2024-11-04
29 000 
Sale
Land
79 m2
-Landes
2024-10-10
3 000 
Sale
Land
2219 m2
-Bois
539 transactions listed in the municipality

Vaucluse (84)

Most expensive cities

City
name
Descending orderHouses
house
Price per m²
6 530 
5 858 
5 508 
5 477 
5 297 
5 055 
5 000 
4 793 
4 691 
City
name
Descending orderApartments
apt.
Price per m²
4 566 
4 536 
3 739 
3 696 
3 693 
3 580 
3 536 

Least expensive cities

City
name
Ascending orderHouses
house
Price per m²
1 333 
1 706 
1 790 
1 835 
2 000 
2 025 
2 066 
City
name
Ascending orderApartments
apt.
Price per m²
588 
1 000 
1 081 
1 136 
1 150 
1 226 
1 228 
1 230 
1 254