emooki
HomePrice mapTransactions
🇬🇧 English🇫🇷 Français🇩🇪 Deutsch🇪🇸 Español🇮🇹 Italiano

Real estate price map


Real estate price map in the municipality of Oppède, choose a section to see transactions by parcel.

Vaucluse (84)
Oppède

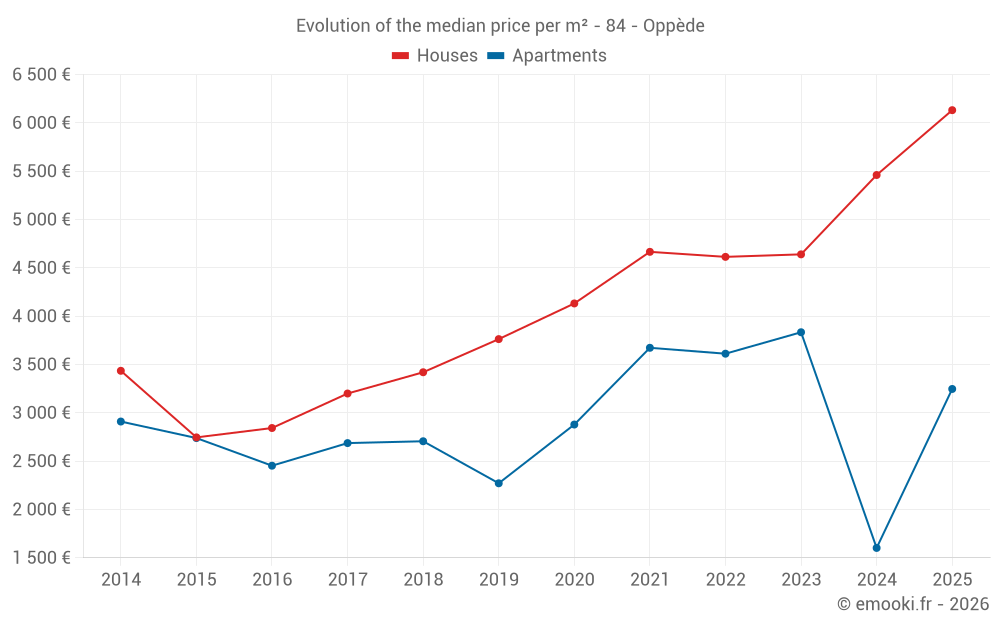
Median price of real estate
in the municipality of Oppède

HousesHouses
4 793  /m²
1-23-45-67-89-10
Reliability 7/10
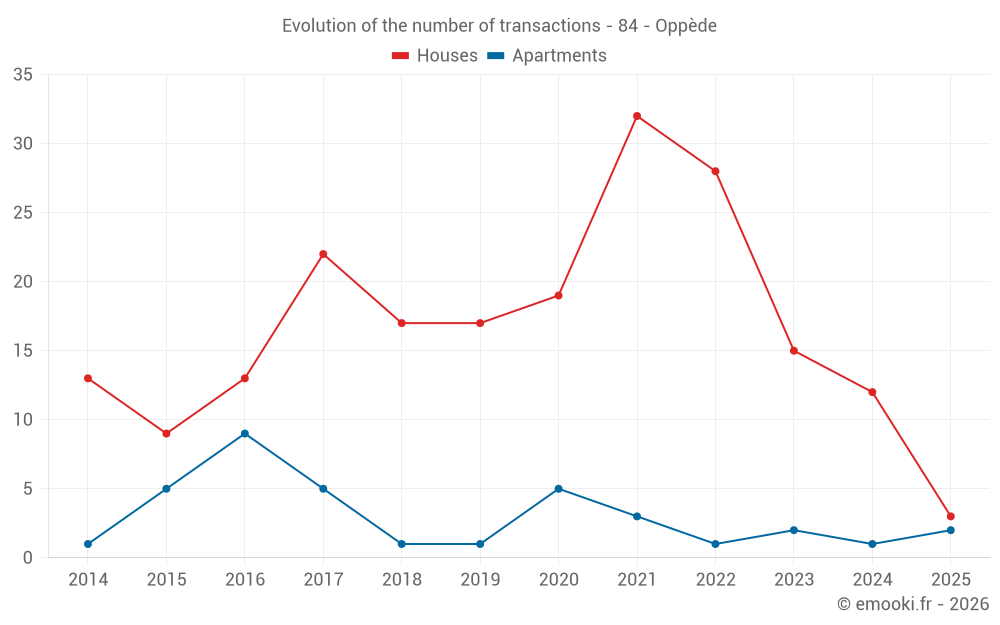
Median price on the 26 transactions of the last 24 months.
from 3 000 to
7 667  /m²
60% of transactions from the 2nd to the 8th deciles.
ApartmentsApartments
3 318  /m²
1-23-45-67-89-10
Reliability 4/10
Median price on the 12 transactions of the last 60 months.
from 2 903 to
3 698  /m²
60% of transactions from the 2nd to the 8th deciles.
DwellingsDwellings
4 477  /m²
1-23-45-67-89-10
Reliability 7/10
Median price on the 29 transactions of the last 24 months.
from 2 976 to
7 345  /m²
60% of transactions from the 2nd to the 8th deciles.

Yearly evolution

Evolution of the median price per m²

Evolution of the number of transactions

Warning, last year incomplete. Projections made based on the proportions between semesters of the previous year at the departmental/national level and by type of property.

Yearly data

Descending order
Year
Houses
house
transactions
Houses
house
Price per m²
Apartments
apt.
transactions
Apartments
apt.
Price per m²
2025
3
6 132 
2
3 247 
2024
12
5 461 
1
1 602 
2023
15
4 640 
2
3 834 
2022
28
4 614 
1
3 612 
2021
32
4 666 
3
3 673 
2020
19
4 132 
5
2 879 
2019
17
3 763 
1
2 271 
2018
17
3 420 
1
2 706 
2017
22
3 200 
5
2 687 
2016
13
2 843 
9
2 453 
2015
9
2 746 
5
2 739 
2014
13
3 435 
1
2 910 

Analysis

Structure of prices per m²

Values of price percentiles per m² over the periods used for the estimated price of each type of property.

Structure of transaction amounts

Values of transaction amounts percentiles over the periods used for the estimated price of each type of property.

Transaction amounts and prices per m² by percentile

Ascending order
Percentile
Houses
house
Price per m²
Houses
house
Transaction amount
Apartments
apt.
Price per m²
Apartments
apt.
Transaction amount
10th percentile
2 390 
185 K
1 730 
135 K
20th percentile
3 000 
360 K
2 903 
151 K
30th percentile
3 522 
415 K
3 069 
166 K
40th percentile
4 097 
450 K
3 243 
222 K
50th percentile
4 793 
478 K
3 318 
276 K
60th percentile
5 500 
575 K
3 515 
297 K
70th percentile
6 066 
667 K
3 655 
309 K
80th percentile
7 667 
900 K
3 698 
350 K
90th percentile
8 586 
1 277 K
4 143 
527 K

National and departmental comparison

Evolution of the median price per m² of houses

Evolution of the median price per m² of apartments

Quarterly evolution

Evolution of the median price per m²

Evolution of the number of transactions

Quarterly data

Descending order
Quarter
Houses
house
transactions
Houses
house
Price per m²
Apartments
apt.
transactions
Apartments
apt.
Price per m²
2025 Q2
2
5 732 
1
3 265 
2025 Q1
1
6 132 
1
3 229 
2024 Q4
2
5 549 
0
--- 
2024 Q3
4
2 977 
0
--- 
2024 Q2
2
6 364 
0
--- 
2024 Q1
4
6 905 
1
1 602 
2023 Q4
6
3 988 
0
--- 
2023 Q3
5
4 640 
0
--- 
2023 Q2
3
5 214 
1
4 667 
2023 Q1
1
6 599 
1
3 000 
2022 Q4
11
4 617 
0
--- 
2022 Q3
4
4 110 
0
--- 
2022 Q2
5
5 643 
1
3 612 
2022 Q1
8
4 669 
0
--- 
2021 Q4
8
5 985 
0
--- 
2021 Q3
13
4 531 
1
3 673 
2021 Q2
3
3 855 
0
--- 
2021 Q1
8
6 014 
2
2 627 
2020 Q4
8
4 066 
2
3 536 
2020 Q3
4
3 702 
1
3 370 
2020 Q2
4
5 094 
2
1 678 
2020 Q1
3
4 194 
0
--- 
2019 Q4
5
2 299 
0
--- 
2019 Q3
3
3 763 
0
--- 
2019 Q2
4
4 900 
1
2 271 
2019 Q1
5
3 421 
0
--- 
2018 Q4
3
3 249 
0
--- 
2018 Q3
6
6 297 
1
2 706 
2018 Q2
5
2 781 
0
--- 
2018 Q1
3
3 450 
0
--- 
2017 Q4
7
3 680 
1
2 682 
2017 Q3
8
3 136 
1
2 687 
2017 Q2
5
2 710 
1
2 613 
2017 Q1
2
3 296 
2
2 986 
2016 Q4
3
3 571 
1
4 365 
2016 Q3
4
2 426 
2
2 578 
2016 Q2
4
3 240 
3
2 880 
2016 Q1
2
2 592 
3
2 313 
2015 Q4
3
2 952 
2
2 400 
2015 Q3
2
7 623 
1
2 843 
2015 Q2
4
2 585 
2
2 312 
2014 Q4
4
2 651 
0
--- 
2014 Q3
3
3 435 
1
2 910 
2014 Q2
1
2 825 
0
--- 
2014 Q1
5
4 096 
0
--- 

Overview of the latest real estate transactions

The following list is an anonymized overview of the latest transactions. For more details and to find all transactions, please use the map to view transactions by plot or the transaction search page for a search by criteria.

2025-06-13
4 425 
Sale
Land
1275 m2
-Terres
2025-05-28
410 000 
3 796  /m²(108 m²)
Sale
Land
665 m2
-Sols
Land
1000 m2
-Terres
Houses
House
5 rooms
108 m2
Land
150 m2
-Sols
2025-05-15
291 000 
871  /m²(334 m²)
Sale
Commercial property
81 m2
Commercial property
49 m2
Commercial property
204 m2
1 outbuilding
Land
7304 m2
-Vignes
2025-04-28
1 150 000 
7 667  /m²(150 m²)
Sale
Houses
House
5 rooms
150 m2
1 outbuilding
Land
1069 m2
-Sols
Land
11965 m2
-Vignes
2025-04-22
271 000 
3 265  /m²(83 m²)
Sale
Apartments
Apartment
3 rooms
83 m2
2 outbuildings
2025-04-15
44 
Sale
Land
88 m2
-Landes
2025-04-09
4 444 580 
15 705  /m²(283 m²)
19 842  /m²(224 m²)
Sale
Houses
House
4 rooms
179 m2
Commercial property
59 m2
2 outbuildings
Land
2120 m2
-Sols
Apartments
Apartment
2 rooms
45 m2
Land
64 m2
-Sols
Land
2390 m2
-Vignes
Land
1290 m2
-Vignes
Land
2710 m2
-Vignes
Land
2530 m2
-Vignes
Land
1755 m2
-Vignes
Land
1875 m2
-Vignes
Land
12930 m2
-Vignes
Land
500 m2
-Vergers
Land
2500 m2
-Vignes
Land
502 m2
-Vignes
Land
7087 m2
-Vignes
Land
7665 m2
-Vignes
Land
15 m2
-Sols
Land
985 m2
-Vergers
Land
780 m2
-Bois
Land
620 m2
-Bois
Land
2800 m2
-Terres
Land
2380 m2
-Terres
Land
3185 m2
-Vignes
Land
2150 m2
-Terres
Land
1805 m2
-Landes
Land
2890 m2
-Terres
Land
1320 m2
-Vergers
/Oliveraie ou oliviers
2025-03-25
3 150 
Sale
1 outbuilding
2025-03-17
155 000 
3 229  /m²(48 m²)
Sale
Apartments
Apartment
2 rooms
48 m2
2 outbuildings
2025-03-10
5 000 
Sale
Land
3000 m2
-Prés
2025-02-27
6 000 
Sale
Land
1200 m2
-Bois
2025-02-26
8 000 
Sale
Land
2305 m2
-Terres
2025-02-26
688 785 
Sale
Land
894 m2
-Sols
2025-01-15
650 000 
6 132  /m²(106 m²)
Sale
Houses
House
4 rooms
106 m2
1 outbuilding
Land
4941 m2
-Bois
Land
1000 m2
-Sols
Land
1276 m2
-Bois
2025-01-09
80 000 
Sale
Land
301 m2
-Sols
Land
31 m2
-Terres
2024-12-16
70 000 
Sale
Land
249 m2
-Sols
2024-12-10
420 
Sale
Land
21 m2
-Landes
2024-10-30
484 300 
5 098  /m²(95 m²)
Sale
Houses
House
5 rooms
95 m2
1 outbuilding
Land
700 m2
-Sols
2024-10-21
440 000 
1 375  /m²(320 m²)
6 286  /m²(70 m²)
Sale
Houses
House
2 rooms
70 m2
Commercial property
250 m2
Land
927 m2
-Sols
Land
136 m2
-Sols
2024-10-09
420 000 
6 000  /m²(70 m²)
Sale
Houses
House
4 rooms
70 m2
1 outbuilding
Land
1000 m2
-Sols
Land
7315 m2
-Bois
Land
1835 m2
-Bois
450 transactions listed in the municipality

Vaucluse (84)

Most expensive cities

City
name
Descending orderHouses
house
Price per m²
6 530 
5 858 
5 508 
5 477 
5 297 
5 055 
5 000 
4 793 
4 691 
City
name
Descending orderApartments
apt.
Price per m²
4 566 
4 536 
3 739 
3 696 
3 693 
3 580 
3 536 

Least expensive cities

City
name
Ascending orderHouses
house
Price per m²
1 333 
1 706 
1 790 
1 835 
2 000 
2 025 
2 066 
City
name
Ascending orderApartments
apt.
Price per m²
588 
1 000 
1 081 
1 136 
1 150 
1 226 
1 228 
1 230 
1 254