Median price of real estate
in the municipality of Roquemaure
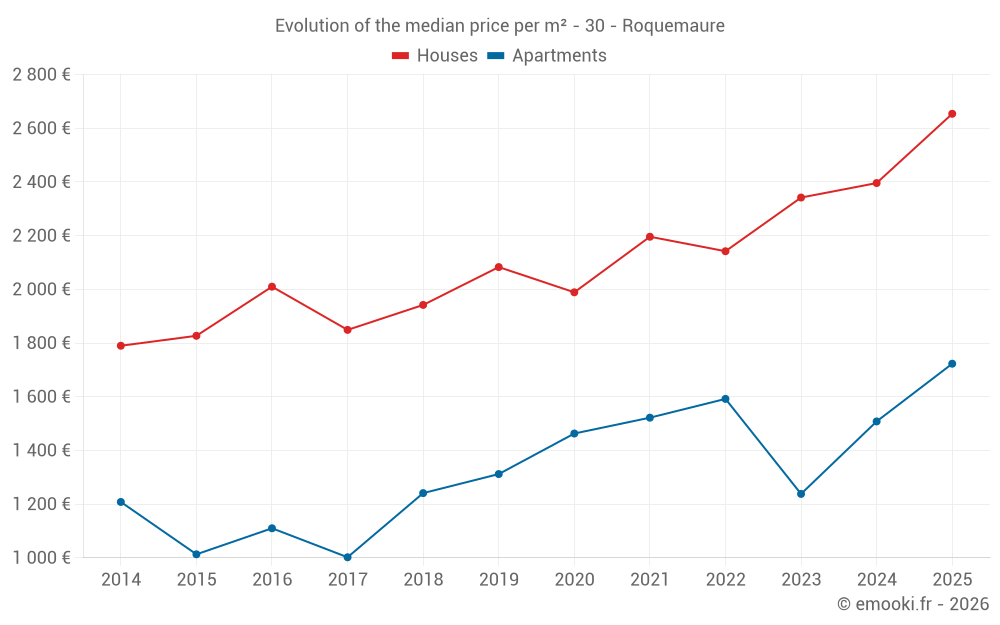
Houses
2 559 € /m²
Reliability 8/10
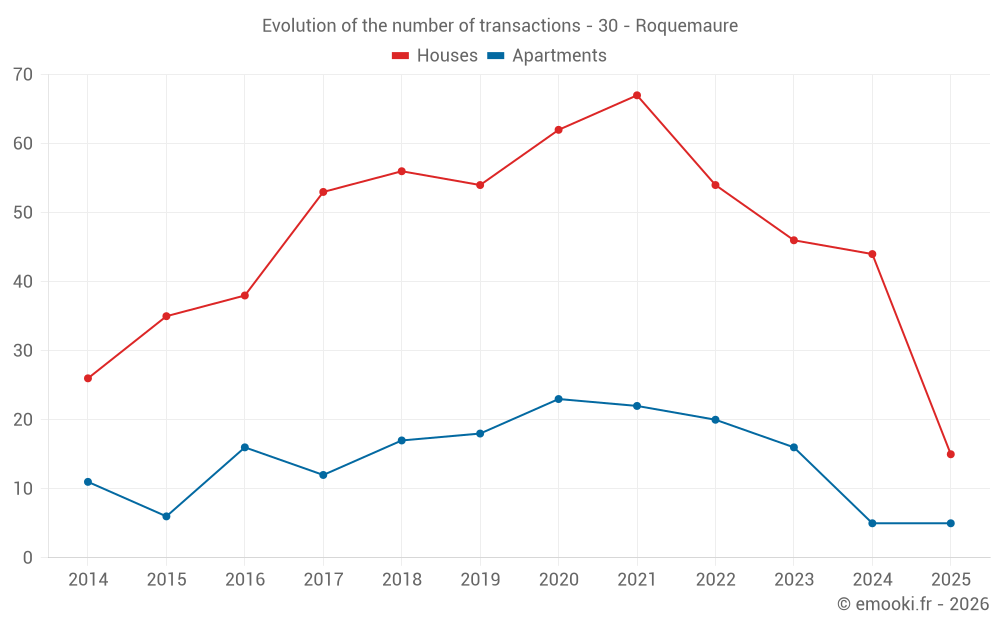
Median price on the 44 transactions of the last 12 months.
from 1 919 to
3 338 € /m²
3 338 € /m²
60% of transactions from the 2nd to the 8th deciles.
Apartments
1 396 € /m²
Reliability 7/10
Median price on the 14 transactions of the last 24 months.
from 1 179 to
1 850 € /m²
1 850 € /m²
60% of transactions from the 2nd to the 8th deciles.
Dwellings
2 388 € /m²
Reliability 9/10
Median price on the 20 transactions of the last 6 months.
from 1 645 to
2 823 € /m²
2 823 € /m²
60% of transactions from the 2nd to the 8th deciles.