emooki
HomePrice mapTransactions
🇬🇧 English🇫🇷 Français🇩🇪 Deutsch🇪🇸 Español🇮🇹 Italiano

Real estate price map


Real estate price map in the municipality of Saint-Cyr-sur-Mer, choose a section to see transactions by parcel.

Var (83)

Saint-Cyr-sur-Mer - Real estate price m²

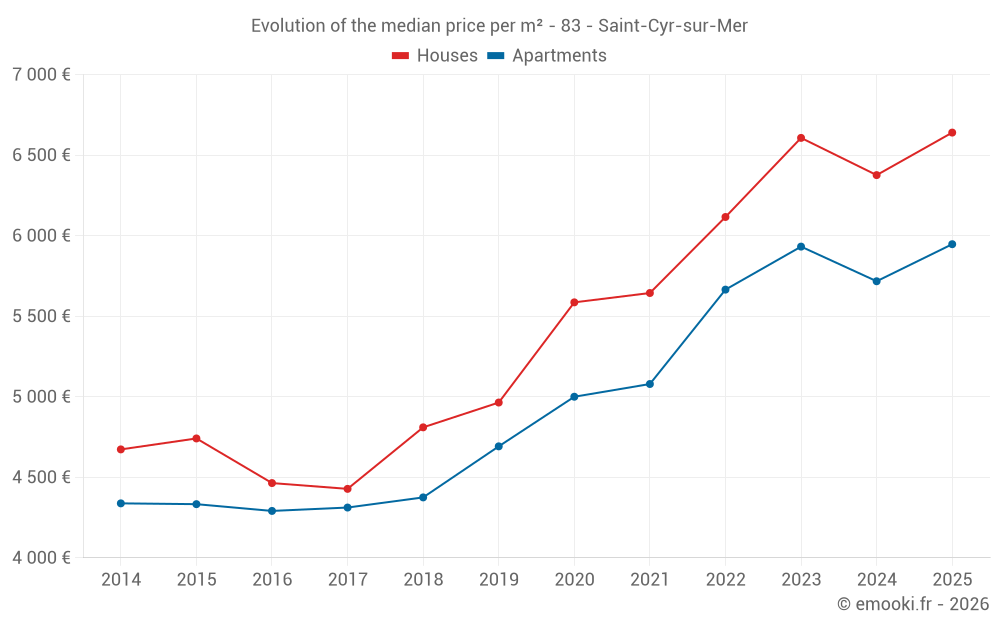
Median price of real estate
in the municipality of Saint-Cyr-sur-Mer

HousesHouses
6 659  /m²
1-23-45-67-89-10
Reliability 10/10
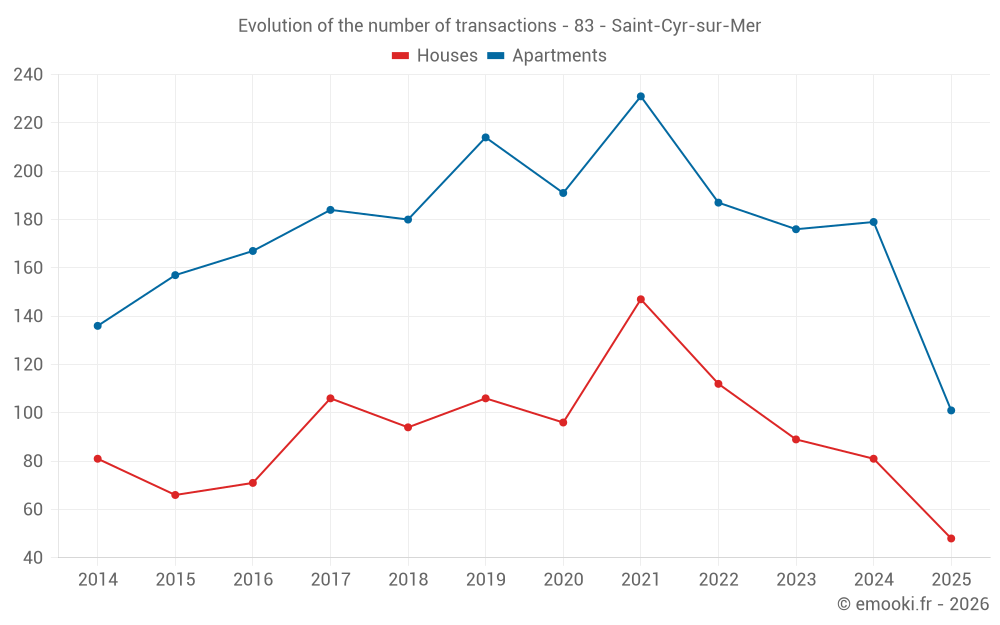
Median price on the 25 transactions of the last 3 months.
from 5 721 to
8 317  /m²
60% of transactions from the 2nd to the 8th deciles.
ApartmentsApartments
6 254  /m²
1-23-45-67-89-10
Reliability 10/10
Median price on the 44 transactions of the last 3 months.
from 4 755 to
7 323  /m²
60% of transactions from the 2nd to the 8th deciles.
DwellingsDwellings
6 321  /m²
1-23-45-67-89-10
Reliability 10/10
Median price on the 69 transactions of the last 3 months.
from 5 210 to
7 551  /m²
60% of transactions from the 2nd to the 8th deciles.
HousesEvolution of the price per m² of houses since...
1 year
+4.1%
2 years
+0.5%
3 years
+8.6%
4 years
+18%
5 years
+19%
6 years
+34%
7 years
+38%
8 years
+50%
9 years
+49%
10 years
+40%
11 years
+42%
ApartmentsEvolution of the price per m² of apartments since...
1 year
+4%
2 years
+0.3%
3 years
+5%
4 years
+17%
5 years
+19%
6 years
+27%
7 years
+36%
8 years
+38%
9 years
+39%
10 years
+37%
11 years
+37%

Yearly evolution

Evolution of the median price per m²

Evolution of the median price per m² - 83 - Saint-Cyr-sur-Mer

Evolution of the number of transactions

Warning, last year incomplete. Projections made based on the proportions between semesters of the previous year at the departmental/national level and by type of property.

Evolution of the number of transactions - 83 - Saint-Cyr-sur-Mer

Yearly data

Descending order
Year
Houses
house
transactions
Houses
house
Price per m²
Apartments
apt.
transactions
Apartments
apt.
Price per m²
2025
48
6 640 
101
5 947 
2024
81
6 376 
179
5 717 
2023
89
6 607 
176
5 932 
2022
112
6 116 
187
5 665 
2021
147
5 644 
231
5 079 
2020
96
5 586 
191
5 000 
2019
106
4 964 
214
4 692 
2018
94
4 810 
180
4 375 
2017
106
4 428 
184
4 312 
2016
71
4 464 
167
4 291 
2015
66
4 741 
157
4 333 
2014
81
4 673 
136
4 338 

Analysis

Structure of prices per m²

Values of price percentiles per m² over the periods used for the estimated price of each type of property.

Structure of transaction amounts

Values of transaction amounts percentiles over the periods used for the estimated price of each type of property.

Transaction amounts and prices per m² by percentile

Ascending order
Percentile
Houses
house
Price per m²
Houses
house
Transaction amount
Apartments
apt.
Price per m²
Apartments
apt.
Transaction amount
10th percentile
5 180 
454 K
4 051 
152 K
20th percentile
5 721 
528 K
4 755 
182 K
30th percentile
6 112 
643 K
5 476 
200 K
40th percentile
6 306 
692 K
5 800 
218 K
50th percentile
6 659 
719 K
6 254 
245 K
60th percentile
7 264 
778 K
6 416 
275 K
70th percentile
7 510 
828 K
6 995 
305 K
80th percentile
8 317 
906 K
7 323 
346 K
90th percentile
11 291 
1 253 K
7 598 
425 K

National and departmental comparison

Evolution of the median price per m² of houses

Evolution of the median price per m² of apartments

Quarterly evolution

Evolution of the median price per m²

Evolution of the number of transactions

Quarterly data

Descending order
Quarter
Houses
house
transactions
Houses
house
Price per m²
Apartments
apt.
transactions
Apartments
apt.
Price per m²
2025 Q2
25
6 659 
44
6 254 
2025 Q1
23
6 622 
57
5 873 
2024 Q4
23
6 731 
56
5 672 
2024 Q3
15
5 385 
52
5 826 
2024 Q2
16
5 757 
42
5 584 
2024 Q1
27
6 422 
29
5 980 
2023 Q4
24
6 460 
48
5 744 
2023 Q3
23
7 139 
46
6 012 
2023 Q2
26
6 972 
43
6 000 
2023 Q1
16
7 244 
39
6 134 
2022 Q4
23
5 935 
41
5 763 
2022 Q3
31
6 605 
47
5 714 
2022 Q2
29
5 873 
50
5 408 
2022 Q1
29
6 002 
49
5 703 
2021 Q4
23
5 850 
62
5 000 
2021 Q3
51
5 650 
62
5 205 
2021 Q2
40
5 830 
67
5 000 
2021 Q1
33
4 917 
40
5 120 
2020 Q4
29
5 940 
67
5 074 
2020 Q3
22
5 318 
41
5 184 
2020 Q2
22
5 553 
39
4 844 
2020 Q1
23
5 424 
44
4 521 
2019 Q4
30
4 733 
56
4 958 
2019 Q3
31
5 000 
60
4 878 
2019 Q2
25
5 298 
54
4 605 
2019 Q1
20
4 960 
44
4 486 
2018 Q4
21
4 545 
43
4 348 
2018 Q3
34
4 836 
43
4 347 
2018 Q2
24
4 770 
52
4 422 
2018 Q1
15
5 003 
42
4 377 
2017 Q4
18
4 415 
40
4 456 
2017 Q3
41
4 487 
49
4 467 
2017 Q2
28
3 967 
47
4 217 
2017 Q1
19
4 955 
48
4 394 
2016 Q4
18
4 618 
44
4 359 
2016 Q3
18
4 554 
49
4 099 
2016 Q2
14
4 302 
32
4 612 
2016 Q1
21
4 204 
42
4 234 
2015 Q4
23
4 667 
54
4 522 
2015 Q3
15
5 329 
46
4 263 
2015 Q2
13
4 738 
24
4 169 
2015 Q1
15
4 219 
33
4 333 
2014 Q4
15
4 152 
25
4 361 
2014 Q3
29
4 867 
40
4 073 
2014 Q2
21
4 712 
35
4 318 
2014 Q1
16
4 884 
36
4 612 

Overview of the latest real estate transactions

The following list is an anonymized overview of the latest transactions. For more details and to find all transactions, please use the map to view transactions by plot or the transaction search page for a search by criteria.

2025-06-27
1 380 952 
12 330  /m²(112 m²)
Sale
Houses
House
4 rooms
112 m2
1 outbuilding
Land
1017 m2
-Sols
2025-06-26
15 400 
Sale
2 outbuildings
2025-06-20
218 000 
6 229  /m²(35 m²)
Sale
Apartments
Apartment
2 rooms
35 m2
1 outbuilding
2025-06-17
210 000 
2 838  /m²(74 m²)
Sale
Commercial property
74 m2
2025-06-16
392 500 
5 947  /m²(66 m²)
Sale
Apartments
Apartment
3 rooms
66 m2
2 outbuildings
2025-06-13
1 450 000 
6 304  /m²(230 m²)
Sale
Houses
House
5 rooms
230 m2
1 outbuilding
Land
922 m2
-Sols
Land
997 m2
-Sols
Land
7 m2
-Sols
Land
173 m2
-Sols
Land
51 m2
-Terres
2025-06-13
317 600 
8 144  /m²(39 m²)
Sale
Apartments
Apartment
2 rooms
39 m2
2 outbuildings
2025-06-12
220 000 
7 333  /m²(30 m²)
Sale
Apartments
Apartment
2 rooms
30 m2
1 outbuilding
2025-06-10
10 000 
Sale
1 outbuilding
2025-06-06
264 250 
7 550  /m²(35 m²)
Sale
Apartments
Apartment
2 rooms
35 m2
2 outbuildings
2025-06-06
192 000 
7 111  /m²(27 m²)
Sale
Apartments
Apartment
1 room
27 m2
2 outbuildings
2025-06-06
369 800 
4 866  /m²(76 m²)
Sale
Apartments
Apartment
4 rooms
76 m2
2025-06-05
200 000 
4 000  /m²(50 m²)
Sale
Commercial property
50 m2
Land
60 m2
-Sols
2025-06-05
934 850 
6 678  /m²(140 m²)
Sale
Houses
House
5 rooms
140 m2
Land
500 m2
-Sols
Land
1482 m2
-Terrains d'agrément
2025-06-04
690 000 
5 750  /m²(120 m²)
Sale
Houses
House
5 rooms
120 m2
Land
591 m2
-Sols
2025-06-04
274 000 
4 419  /m²(62 m²)
Sale
1 outbuilding
Apartments
Apartment
3 rooms
62 m2
2025-06-02
35 000 
Sale
1 outbuilding
2025-06-02
150 000 
Sale
Land
155 m2
-Landes
Land
220 m2
-Sols
2025-05-28
30 000 
Sale
1 outbuilding
2025-05-28
885 000 
5 028  /m²(176 m²)
Sale
Houses
House
6 rooms
176 m2
1 outbuilding
Land
811 m2
-Sols
4586 transactions listed in the municipality

Var (83)

Most expensive cities

City
name
Descending orderHouses
house
Price per m²
29 062 
20 110 
9 205 
9 164 
7 834 
7 731 
7 394 
7 043 
7 014 
City
name
Descending orderApartments
apt.
Price per m²
12 692 
10 000 
7 656 
6 722 
6 667 
6 316 
6 264 
6 083 

Least expensive cities

City
name
Ascending orderHouses
house
Price per m²
1 250 
1 531 
1 825 
1 905 
1 925 
1 952 
1 998 
2 067 
2 083 
City
name
Ascending orderApartments
apt.
Price per m²
660 
738 
923 
950 
1 015 
1 033 
1 113 
1 229