emooki
HomePrice mapTransactions
🇬🇧 English🇫🇷 Français🇩🇪 Deutsch🇪🇸 Español🇮🇹 Italiano

Real estate price map


Real estate price map in the municipality of Draguignan, choose a section to see transactions by parcel.

Var (83)

Draguignan - Real estate price m²

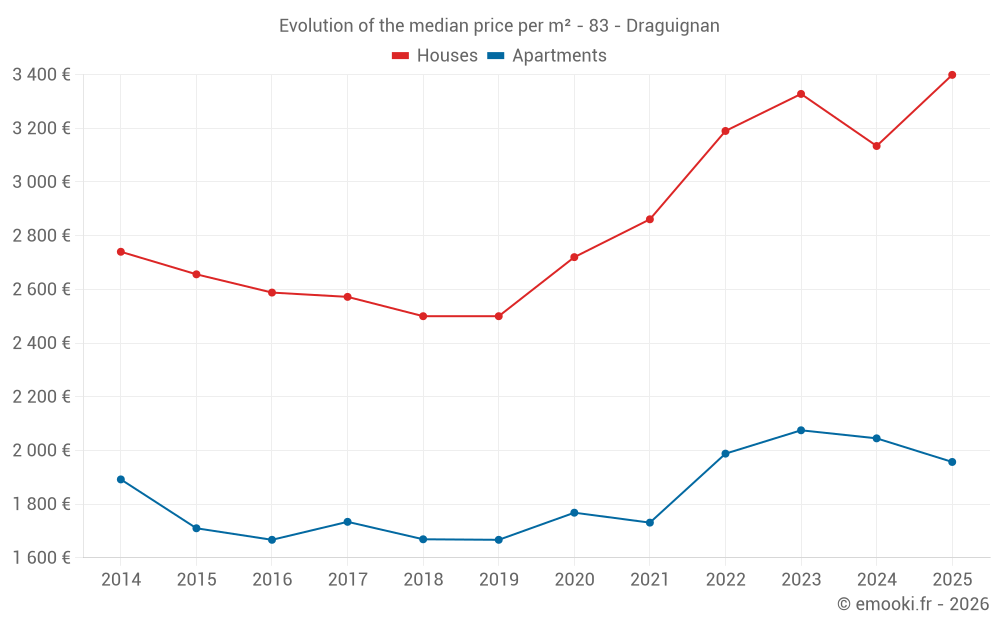
Median price of real estate
in the municipality of Draguignan

HousesHouses
3 546  /m²
1-23-45-67-89-10
Reliability 10/10
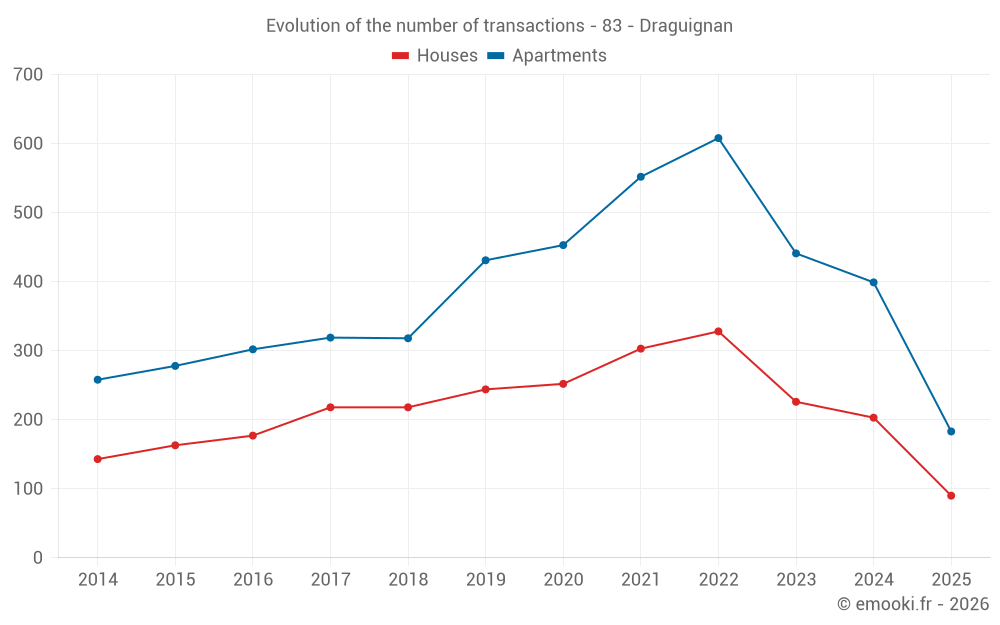
Median price on the 37 transactions of the last 3 months.
from 3 002 to
3 967  /m²
60% of transactions from the 2nd to the 8th deciles.
ApartmentsApartments
1 865  /m²
1-23-45-67-89-10
Reliability 10/10
Median price on the 86 transactions of the last 3 months.
from 1 388 to
2 333  /m²
60% of transactions from the 2nd to the 8th deciles.
DwellingsDwellings
2 143  /m²
1-23-45-67-89-10
Reliability 10/10
Median price on the 123 transactions of the last 3 months.
from 1 446 to
3 467  /m²
60% of transactions from the 2nd to the 8th deciles.
HousesEvolution of the price per m² of houses since...
1 year
+8.5%
2 years
+2.1%
3 years
+6.6%
4 years
+19%
5 years
+25%
6 years
+36%
7 years
+36%
8 years
+32%
9 years
+31%
10 years
+28%
11 years
+24%
ApartmentsEvolution of the price per m² of apartments since...
1 year
-4.3%
2 years
-5.7%
3 years
-1.6%
4 years
+13%
5 years
+11%
6 years
+17%
7 years
+17%
8 years
+13%
9 years
+17%
10 years
+14%
11 years
+3.4%
The price per m² of apartments has decreased by 5.7% since 2 years, but it has increased by 17% in 6 years.

Yearly evolution

Evolution of the median price per m²

Evolution of the median price per m² - 83 - Draguignan

Evolution of the number of transactions

Warning, last year incomplete. Projections made based on the proportions between semesters of the previous year at the departmental/national level and by type of property.

Evolution of the number of transactions - 83 - Draguignan

Yearly data

Descending order
Year
Houses
house
transactions
Houses
house
Price per m²
Apartments
apt.
transactions
Apartments
apt.
Price per m²
2025
90
3 399 
183
1 957 
2024
203
3 134 
399
2 045 
2023
226
3 328 
441
2 075 
2022
328
3 190 
608
1 988 
2021
303
2 861 
552
1 731 
2020
252
2 720 
453
1 768 
2019
244
2 500 
431
1 667 
2018
218
2 500 
318
1 669 
2017
218
2 572 
319
1 734 
2016
177
2 588 
302
1 667 
2015
163
2 656 
278
1 710 
2014
143
2 740 
258
1 892 

Analysis

Structure of prices per m²

Values of price percentiles per m² over the periods used for the estimated price of each type of property.

Structure of transaction amounts

Values of transaction amounts percentiles over the periods used for the estimated price of each type of property.

Transaction amounts and prices per m² by percentile

Ascending order
Percentile
Houses
house
Price per m²
Houses
house
Transaction amount
Apartments
apt.
Price per m²
Apartments
apt.
Transaction amount
10th percentile
2 632 
269 K
963 
49 500 
20th percentile
3 002 
290 K
1 388 
70 300 
30th percentile
3 255 
309 K
1 513 
79 500 
40th percentile
3 419 
322 K
1 690 
95 000 
50th percentile
3 546 
340 K
1 865 
115 K
60th percentile
3 704 
400 K
2 001 
132 K
70th percentile
3 762 
444 K
2 150 
142 K
80th percentile
3 967 
484 K
2 333 
160 K
90th percentile
4 420 
710 K
2 966 
195 K

National and departmental comparison

Evolution of the median price per m² of houses

Evolution of the median price per m² of apartments

Quarterly evolution

Evolution of the median price per m²

Evolution of the number of transactions

Quarterly data

Descending order
Quarter
Houses
house
transactions
Houses
house
Price per m²
Apartments
apt.
transactions
Apartments
apt.
Price per m²
2025 Q2
37
3 546 
86
1 865 
2025 Q1
53
3 293 
97
2 055 
2024 Q4
53
3 100 
100
2 006 
2024 Q3
67
3 250 
100
2 118 
2024 Q2
56
3 092 
111
2 045 
2024 Q1
27
3 273 
88
1 868 
2023 Q4
46
3 365 
111
2 007 
2023 Q3
66
3 362 
103
2 058 
2023 Q2
69
3 333 
122
2 218 
2023 Q1
45
3 111 
105
1 992 
2022 Q4
85
3 304 
142
1 968 
2022 Q3
90
3 360 
173
2 071 
2022 Q2
81
3 273 
155
1 989 
2022 Q1
72
2 862 
138
1 928 
2021 Q4
84
2 805 
118
1 856 
2021 Q3
91
2 930 
149
1 694 
2021 Q2
66
2 790 
157
1 780 
2021 Q1
62
2 945 
128
1 752 
2020 Q4
76
2 699 
148
1 789 
2020 Q3
72
2 746 
106
1 932 
2020 Q2
44
2 698 
94
1 617 
2020 Q1
60
2 725 
105
1 647 
2019 Q4
59
2 655 
118
1 639 
2019 Q3
67
2 659 
112
1 624 
2019 Q2
68
2 434 
115
1 709 
2019 Q1
50
2 327 
86
1 690 
2018 Q4
57
2 336 
81
1 561 
2018 Q3
73
2 603 
90
1 665 
2018 Q2
41
2 639 
81
1 629 
2018 Q1
47
2 449 
66
1 774 
2017 Q4
47
2 750 
84
1 740 
2017 Q3
59
2 522 
66
1 711 
2017 Q2
62
2 537 
91
1 691 
2017 Q1
50
2 595 
78
1 770 
2016 Q4
39
2 647 
71
1 667 
2016 Q3
61
2 595 
74
1 782 
2016 Q2
53
2 353 
79
1 614 
2016 Q1
24
2 630 
78
1 656 
2015 Q4
39
2 500 
72
1 622 
2015 Q3
61
2 761 
71
1 864 
2015 Q2
37
2 576 
69
1 716 
2015 Q1
26
2 766 
66
1 649 
2014 Q4
33
2 485 
65
1 846 
2014 Q3
52
2 750 
68
2 126 
2014 Q2
31
2 787 
68
1 864 
2014 Q1
27
2 745 
57
1 654 

Overview of the latest real estate transactions

The following list is an anonymized overview of the latest transactions. For more details and to find all transactions, please use the map to view transactions by plot or the transaction search page for a search by criteria.

2025-06-25
15 000 
682  /m²(22 m²)
Sale
Apartments
Apartment
1 room
22 m2
2025-06-24
120 000 
1 846  /m²(65 m²)
Sale
Apartments
Apartment
3 rooms
65 m2
1 outbuilding
2025-06-24
28 000 
1 400  /m²(20 m²)
Sale
Commercial property
20 m2
2025-06-24
75 000 
2 273  /m²(33 m²)
Sale
Apartments
Apartment
1 room
33 m2
1 outbuilding
2025-06-20
275 000 
3 161  /m²(87 m²)
Sale
Houses
House
4 rooms
87 m2
2 outbuildings
Land
1194 m2
-Sols
2025-06-19
137 000 
2 015  /m²(68 m²)
Sale
Apartments
Apartment
4 rooms
68 m2
1 outbuilding
1 outbuilding
2025-06-19
440 000 
4 400  /m²(100 m²)
Sale
Houses
House
4 rooms
100 m2
1 outbuilding
Land
600 m2
-Sols
Land
80 m2
-Sols
Land
38 m2
-Sols
Land
18 m2
-Sols
2025-06-19
142 000 
1 797  /m²(79 m²)
Sale
Apartments
Apartment
3 rooms
79 m2
2025-06-18
180 000 
1 714  /m²(105 m²)
Sale
Apartments
Apartment
3 rooms
105 m2
2 outbuildings
2025-06-18
160 000 
1 905  /m²(84 m²)
Sale
Apartments
Apartment
3 rooms
84 m2
1 outbuilding
2025-06-18
40 000 
1 667  /m²(24 m²)
Sale
Apartments
Apartment
2 rooms
24 m2
2025-06-18
130 000 
1 398  /m²(93 m²)
Sale
Apartments
Apartment
4 rooms
93 m2
2025-06-18
50 000 
2 500  /m²(20 m²)
Sale
Commercial property
20 m2
2 outbuildings
2025-06-17
229 000 
2 793  /m²(82 m²)
Sale
Apartments
Apartment
4 rooms
82 m2
1 outbuilding
2025-06-17
211 100 
2 932  /m²(72 m²)
Sale
Apartments
Apartment
3 rooms
72 m2
1 outbuilding
2025-06-16
22 500 
726  /m²(31 m²)
Sale
Apartments
Apartment
3 rooms
31 m2
2025-06-16
105 000 
724  /m²(145 m²)
Sale
Commercial property
52 m2
Commercial property
93 m2
Land
45 m2
-Sols
2025-06-16
49 000 
1 690  /m²(29 m²)
Sale
Apartments
Apartment
2 rooms
29 m2
2025-06-16
165 000 
3 438  /m²(48 m²)
Sale
Houses
House
3 rooms
48 m2
Land
671 m2
-Sols
2025-06-13
335 000 
3 941  /m²(85 m²)
Sale
Houses
House
4 rooms
85 m2
4 outbuildings
Land
3035 m2
-Vignes
Land
1227 m2
-Sols
Land
2000 m2
-Terrains d'agrément
10045 transactions listed in the municipality

Var (83)

Most expensive cities

City
name
Descending orderHouses
house
Price per m²
29 062 
20 110 
9 205 
9 164 
7 834 
7 731 
7 394 
7 043 
7 014 
City
name
Descending orderApartments
apt.
Price per m²
12 692 
10 000 
7 656 
6 722 
6 667 
6 316 
6 264 
6 083 

Least expensive cities

City
name
Ascending orderHouses
house
Price per m²
1 250 
1 531 
1 825 
1 905 
1 925 
1 952 
1 998 
2 067 
2 083 
City
name
Ascending orderApartments
apt.
Price per m²
660 
738 
923 
950 
1 015 
1 033 
1 113 
1 229