emooki
HomePrice mapTransactions
🇬🇧 English🇫🇷 Français🇩🇪 Deutsch🇪🇸 Español🇮🇹 Italiano

Real estate price map


Real estate price map in the municipality of Bailly, choose a section to see transactions by parcel.

Yvelines (78)
Bailly

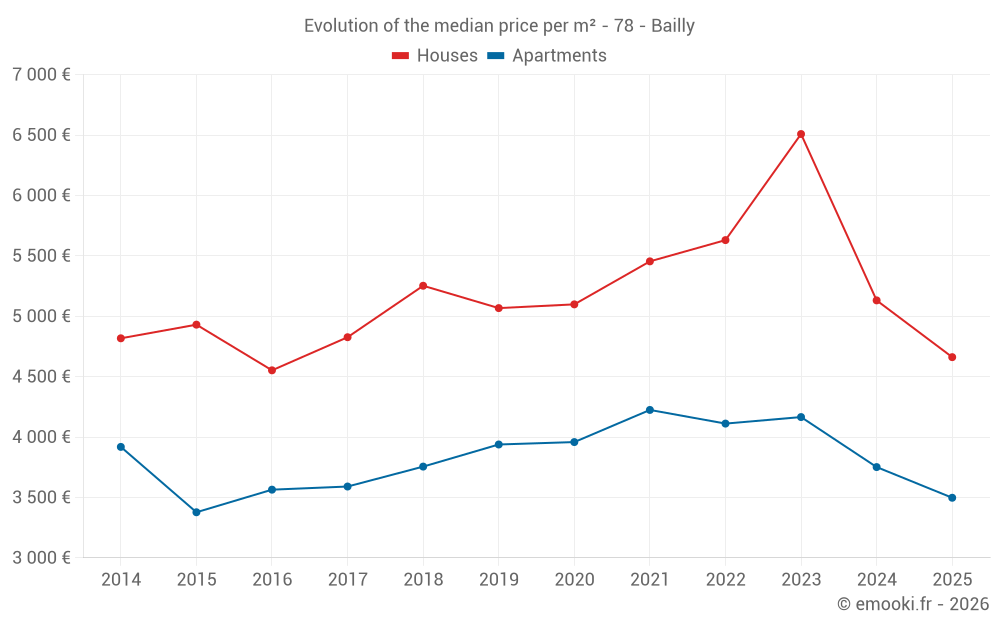
Median price of real estate
in the municipality of Bailly

HousesHouses
4 990 € /m²
1-23-45-67-89-10
Reliability 8/10
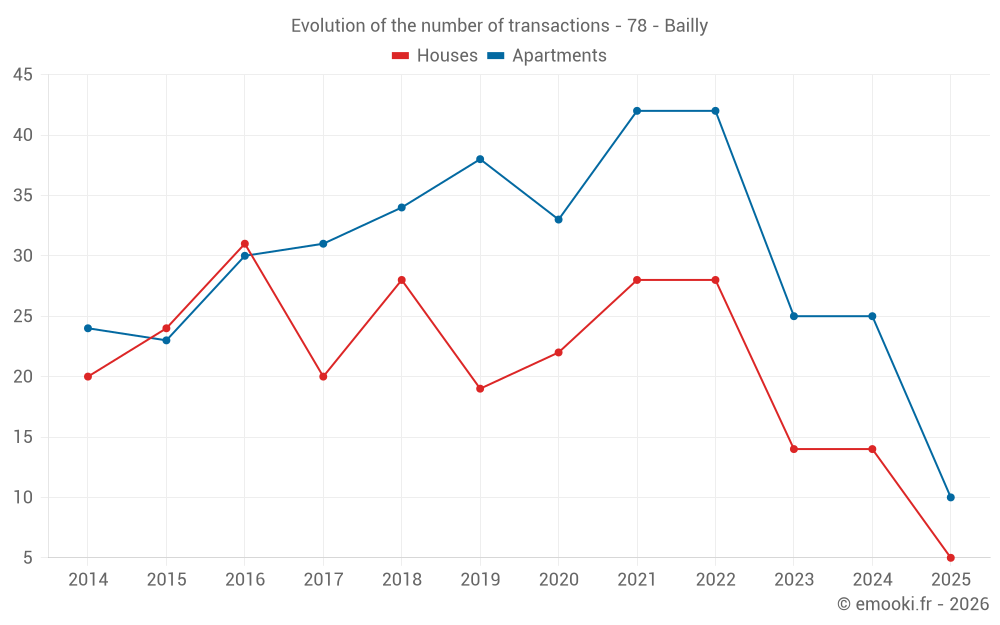
Median price on the 18 transactions of the last 12 months.
from 4 682 to
5 871 € /m²
60% of transactions from the 2nd to the 8th deciles.
ApartmentsApartments
3 737 € /m²
1-23-45-67-89-10
Reliability 8/10
Median price on the 24 transactions of the last 12 months.
from 3 070 to
4 183 € /m²
60% of transactions from the 2nd to the 8th deciles.
DwellingsDwellings
4 185 € /m²
1-23-45-67-89-10
Reliability 8/10
Median price on the 42 transactions of the last 12 months.
from 3 312 to
5 112 € /m²
60% of transactions from the 2nd to the 8th deciles.
HousesEvolution of the price per m² of houses since...
1 year
-9.2%
2 years
-28%
3 years
-17%
4 years
-15%
5 years
-8.6%
6 years
-8%
7 years
-11%
8 years
-3.4%
9 years
+2.4%
10 years
-5.5%
11 years
-3.2%
The price per m² of houses has decreased by 28% since 2 years, but it has increased by 2.4% in 9 years.
ApartmentsEvolution of the price per m² of apartments since...
1 year
-6.8%
2 years
-16%
3 years
-15%
4 years
-17%
5 years
-12%
6 years
-11%
7 years
-6.9%
8 years
-2.6%
9 years
-1.9%
10 years
+3.6%
11 years
-11%
The price per m² of apartments has decreased by 17% since 4 years, but it has increased by 3.6% in 10 years.

Yearly evolution

Evolution of the median price per m²

Evolution of the number of transactions

Warning, last year incomplete. Projections made based on the proportions between semesters of the previous year at the departmental/national level and by type of property.

Yearly data

Descending order
Year
Houses
house
transactions
Houses
house
Price per m²
Apartments
apt.
transactions
Apartments
apt.
Price per m²
2025
5
4 661 €
10
3 497 €
2024
14
5 131 €
25
3 751 €
2023
14
6 508 €
25
4 165 €
2022
28
5 630 €
42
4 111 €
2021
28
5 454 €
42
4 224 €
2020
22
5 098 €
33
3 958 €
2019
19
5 067 €
38
3 938 €
2018
28
5 252 €
34
3 755 €
2017
20
4 826 €
31
3 590 €
2016
31
4 552 €
30
3 564 €
2015
24
4 930 €
23
3 377 €
2014
20
4 817 €
24
3 918 €

Analysis

Structure of prices per m²

Values of price percentiles per m² over the periods used for the estimated price of each type of property.

Structure of transaction amounts

Values of transaction amounts percentiles over the periods used for the estimated price of each type of property.

Transaction amounts and prices per m² by percentile

Ascending order
Percentile
Houses
house
Price per m²
Houses
house
Transaction amount
Apartments
apt.
Price per m²
Apartments
apt.
Transaction amount
10th percentile
4 335 €
539 K€
2 674 €
109 K€
20th percentile
4 682 €
555 K€
3 070 €
170 K€
30th percentile
4 758 €
561 K€
3 263 €
241 K€
40th percentile
4 860 €
606 K€
3 520 €
267 K€
50th percentile
4 990 €
638 K€
3 737 €
286 K€
60th percentile
5 127 €
645 K€
3 778 €
294 K€
70th percentile
5 317 €
696 K€
4 061 €
308 K€
80th percentile
5 871 €
841 K€
4 183 €
339 K€
90th percentile
6 764 €
887 K€
4 428 €
379 K€

National and departmental comparison

Evolution of the median price per m² of houses

Evolution of the median price per m² of apartments

Quarterly evolution

Evolution of the median price per m²

Evolution of the number of transactions

Quarterly data

Descending order
Quarter
Houses
house
transactions
Houses
house
Price per m²
Apartments
apt.
transactions
Apartments
apt.
Price per m²
2025 Q2
3
4 869 €
4
3 156 €
2025 Q1
2
4 260 €
6
3 609 €
2024 Q4
7
5 137 €
4
4 114 €
2024 Q3
6
5 231 €
10
3 737 €
2024 Q2
1
4 633 €
7
3 601 €
2024 Q1
0
--- €
4
4 174 €
2023 Q4
4
6 450 €
7
4 045 €
2023 Q3
3
6 477 €
5
4 224 €
2023 Q2
3
5 650 €
6
4 566 €
2023 Q1
4
6 718 €
7
4 036 €
2022 Q4
6
6 222 €
10
3 864 €
2022 Q3
12
5 774 €
11
4 400 €
2022 Q2
4
6 021 €
17
4 108 €
2022 Q1
6
5 538 €
4
4 186 €
2021 Q4
10
5 654 €
14
4 094 €
2021 Q3
10
5 566 €
6
4 596 €
2021 Q2
4
5 287 €
9
4 268 €
2021 Q1
4
5 122 €
13
4 021 €
2020 Q4
7
5 646 €
8
3 822 €
2020 Q3
6
5 088 €
7
4 568 €
2020 Q2
8
4 803 €
12
3 816 €
2020 Q1
1
3 853 €
6
3 926 €
2019 Q4
5
5 067 €
10
4 316 €
2019 Q3
7
4 548 €
12
3 887 €
2019 Q2
4
5 289 €
11
3 677 €
2019 Q1
3
5 339 €
5
3 319 €
2018 Q4
8
5 082 €
5
3 741 €
2018 Q3
13
5 266 €
15
3 958 €
2018 Q2
3
4 906 €
9
3 548 €
2018 Q1
4
5 066 €
5
3 945 €
2017 Q4
4
5 035 €
8
3 568 €
2017 Q3
8
4 802 €
7
4 070 €
2017 Q2
2
5 256 €
9
3 607 €
2017 Q1
6
4 924 €
7
3 515 €
2016 Q4
5
4 707 €
5
3 956 €
2016 Q3
11
4 500 €
10
3 564 €
2016 Q2
8
4 071 €
11
3 726 €
2016 Q1
7
4 566 €
4
3 500 €
2015 Q4
7
4 917 €
5
3 377 €
2015 Q3
6
4 722 €
8
4 031 €
2015 Q2
10
5 298 €
6
3 260 €
2015 Q1
1
4 220 €
4
2 878 €
2014 Q4
7
4 640 €
3
3 571 €
2014 Q3
8
4 854 €
11
3 626 €
2014 Q2
4
4 927 €
4
4 131 €
2014 Q1
1
5 777 €
6
3 960 €

Overview of the latest real estate transactions

The following list is an anonymized overview of the latest transactions. For more details and to find all transactions, please use the map to view transactions by plot or the transaction search page for a search by criteria.

2025-06-17
569 700 €
4 869 € /m²(117 m²)
Sale
Houses
House
4 rooms
117 m2
Land
248 m2
-Sols
2025-06-11
333 848 €
3 552 € /m²(94 m²)
Sale
Apartments
Apartment
3 rooms
94 m2
4 outbuildings
2025-06-06
147 000 €
1 581 € /m²(93 m²)
Sale
Apartments
Apartment
3 rooms
93 m2
3 outbuildings
2025-06-04
13 500 €
Sale
1 outbuilding
2025-05-20
658 000 €
5 062 € /m²(130 m²)
Sale
Houses
House
6 rooms
130 m2
Land
433 m2
-Sols
2025-04-25
556 000 €
3 106 € /m²(179 m²)
Sale
Houses
House
5 rooms
179 m2
Land
636 m2
-Sols
2025-04-17
326 000 €
1 638 € /m²(199 m²)
Sale
Commercial property
10 m2
Commercial property
10 m2
Commercial property
10 m2
Commercial property
10 m2
Commercial property
159 m2
2025-04-11
283 372 €
4 428 € /m²(64 m²)
Sale
Apartments
Apartment
2 rooms
64 m2
1 outbuilding
2025-04-04
229 150 €
2 761 € /m²(83 m²)
Sale
1 outbuilding
Apartments
Apartment
3 rooms
83 m2
1 outbuilding
2025-03-31
406 280 €
4 146 € /m²(98 m²)
Sale
Apartments
Apartment
5 rooms
98 m2
2 outbuildings
1 outbuilding
2025-03-28
265 000 €
3 442 € /m²(77 m²)
Sale
Apartments
Apartment
3 rooms
77 m2
2 outbuildings
2025-03-25
99 000 €
3 094 € /m²(32 m²)
Sale
Apartments
Apartment
1 room
32 m2
2025-03-14
16 000 €
Sale
1 outbuilding
2025-03-11
3 700 000 €
1 459 € /m²(2536 m²)
17 703 € /m²(209 m²)
Sale
Apartments
Apartment
1 room
32 m2
Apartments
Apartment
1 room
25 m2
Apartments
Apartment
4 rooms
82 m2
Apartments
Apartment
3 rooms
70 m2
Commercial property
1739 m2
Commercial property
588 m2
Land
7558 m2
-Sols
2025-03-07
470 700 €
3 858 € /m²(122 m²)
Sale
Houses
House
5 rooms
122 m2
1 outbuilding
2025-03-07
160 000 €
Sale
Land
1360 m2
-Terres
Land
2265 m2
-Terres
2025-02-19
253 000 €
3 776 € /m²(67 m²)
Sale
Apartments
Apartment
2 rooms
67 m2
2 outbuildings
2025-02-13
1 050 000 €
5 676 € /m²(185 m²)
6 176 € /m²(170 m²)
Sale
Houses
House
6 rooms
170 m2
Commercial property
15 m2
Land
698 m2
-Sols
2025-01-23
550 000 €
4 661 € /m²(118 m²)
Sale
Land
108 m2
-Sols
Houses
House
7 rooms
118 m2
Land
776 m2
-Sols
2025-01-20
289 000 €
3 108 € /m²(93 m²)
Sale
Apartments
Apartment
3 rooms
93 m2
3 outbuildings
823 transactions listed in the municipality

Yvelines (78)

Most expensive cities

City
name
Descending orderHouses
house
Price per m²
8 326 €
7 960 €
7 952 €
7 768 €
7 675 €
7 175 €
7 168 €
6 913 €
6 748 €
6 318 €
City
name
Descending orderApartments
apt.
Price per m²
6 358 €
6 192 €
5 628 €
5 512 €
5 254 €
5 250 €
5 153 €
5 098 €
5 056 €
5 027 €

Least expensive cities

City
name
Ascending orderHouses
house
Price per m²
1 871 €
1 903 €
1 953 €
1 997 €
2 056 €
2 143 €
2 192 €
2 238 €
2 250 €
2 254 €
City
name
Ascending orderApartments
apt.
Price per m²
697 €
729 €
1 274 €
1 500 €
1 526 €
1 578 €
1 594 €
1 675 €
1 710 €
1 714 €