emooki
HomePrice mapTransactions
🇬🇧 English🇫🇷 Français🇩🇪 Deutsch🇪🇸 Español🇮🇹 Italiano

Real estate price map


Real estate price map in the municipality of Versailles, choose a section to see transactions by parcel.

Yvelines (78)

Versailles - Real estate price m²

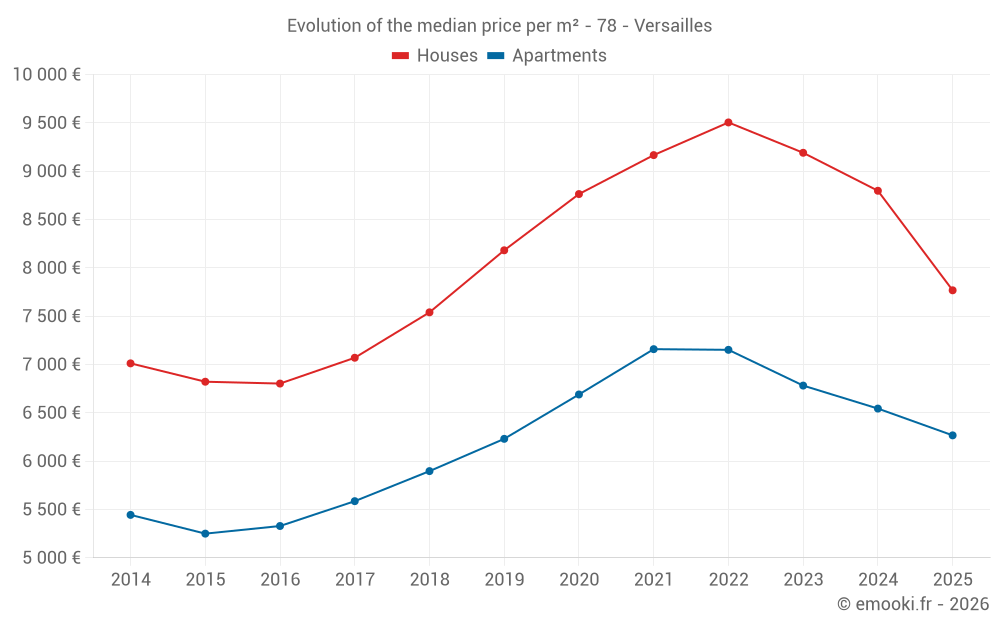
Median price of real estate
in the municipality of Versailles

HousesHouses
7 768  /m²
1-23-45-67-89-10
Reliability 9/10
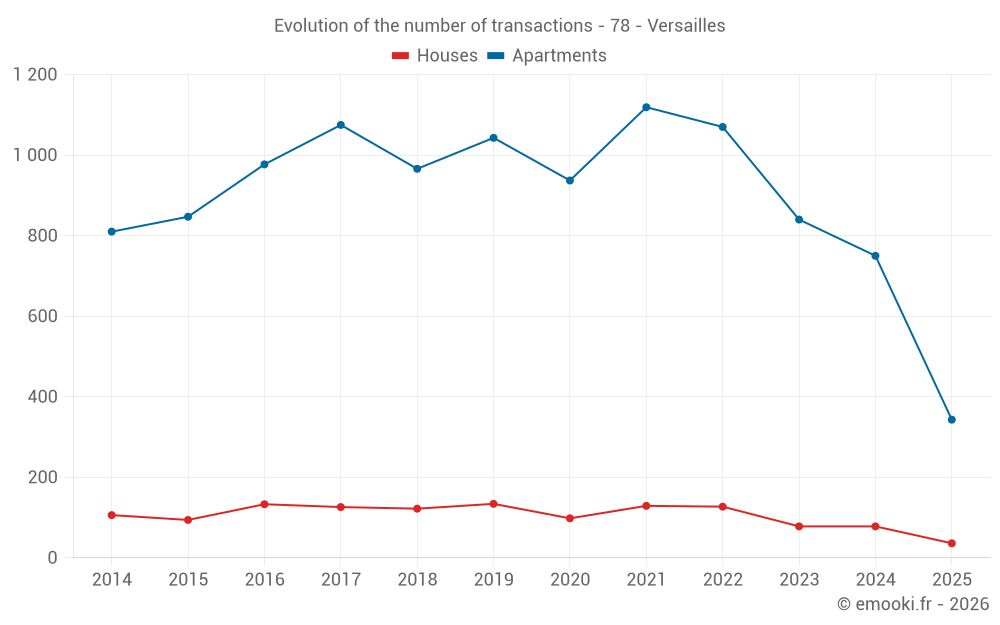
Median price on the 36 transactions of the last 6 months.
from 6 206 to
11 250  /m²
60% of transactions from the 2nd to the 8th deciles.
ApartmentsApartments
6 192  /m²
1-23-45-67-89-10
Reliability 10/10
Median price on the 164 transactions of the last 3 months.
from 4 927 to
7 572  /m²
60% of transactions from the 2nd to the 8th deciles.
DwellingsDwellings
6 277  /m²
1-23-45-67-89-10
Reliability 10/10
Median price on the 180 transactions of the last 3 months.
from 5 000 to
7 593  /m²
60% of transactions from the 2nd to the 8th deciles.
HousesEvolution of the price per m² of houses since...
1 year
-12%
2 years
-15%
3 years
-18%
4 years
-15%
5 years
-11%
6 years
-5.1%
7 years
+3%
8 years
+10%
9 years
+14%
10 years
+14%
11 years
+11%
The price per m² of houses has decreased by 18% since 3 years, but it has increased by 14% in 9 years.
ApartmentsEvolution of the price per m² of apartments since...
1 year
-4.2%
2 years
-7.6%
3 years
-12%
4 years
-12%
5 years
-6.3%
6 years
+0.6%
7 years
+6.3%
8 years
+12%
9 years
+18%
10 years
+19%
11 years
+15%
The price per m² of apartments has decreased by 12% since 4 years, but it has increased by 19% in 10 years.

Yearly evolution

Evolution of the median price per m²

Evolution of the median price per m² - 78 - Versailles

Evolution of the number of transactions

Warning, last year incomplete. Projections made based on the proportions between semesters of the previous year at the departmental/national level and by type of property.

Evolution of the number of transactions - 78 - Versailles

Yearly data

Descending order
Year
Houses
house
transactions
Houses
house
Price per m²
Apartments
apt.
transactions
Apartments
apt.
Price per m²
2025
36
7 768 
343
6 267 
2024
78
8 798 
750
6 544 
2023
78
9 191 
840
6 782 
2022
127
9 505 
1 070
7 152 
2021
129
9 167 
1 119
7 159 
2020
98
8 764 
937
6 690 
2019
134
8 182 
1 043
6 231 
2018
122
7 540 
966
5 897 
2017
126
7 070 
1 075
5 586 
2016
133
6 803 
977
5 329 
2015
94
6 822 
847
5 250 
2014
106
7 012 
810
5 444 

Analysis

Structure of prices per m²

Values of price percentiles per m² over the periods used for the estimated price of each type of property.

Structure of transaction amounts

Values of transaction amounts percentiles over the periods used for the estimated price of each type of property.

Transaction amounts and prices per m² by percentile

Ascending order
Percentile
Houses
house
Price per m²
Houses
house
Transaction amount
Apartments
apt.
Price per m²
Apartments
apt.
Transaction amount
10th percentile
5 104 
593 K
4 345 
143 K
20th percentile
6 206 
799 K
4 927 
191 K
30th percentile
6 809 
871 K
5 381 
240 K
40th percentile
7 379 
1 055 K
5 850 
285 K
50th percentile
7 768 
1 082 K
6 192 
354 K
60th percentile
8 738 
1 254 K
6 679 
429 K
70th percentile
10 480 
1 625 K
7 012 
496 K
80th percentile
11 250 
1 791 K
7 572 
613 K
90th percentile
11 676 
1 990 K
8 210 
744 K

National and departmental comparison

Evolution of the median price per m² of houses

Evolution of the median price per m² of apartments

Quarterly evolution

Evolution of the median price per m²

Evolution of the number of transactions

Quarterly data

Descending order
Quarter
Houses
house
transactions
Houses
house
Price per m²
Apartments
apt.
transactions
Apartments
apt.
Price per m²
2025 Q2
16
6 950 
164
6 192 
2025 Q1
20
8 744 
179
6 349 
2024 Q4
21
9 231 
174
6 546 
2024 Q3
27
8 746 
236
6 606 
2024 Q2
16
8 326 
195
6 467 
2024 Q1
14
8 647 
145
6 520 
2023 Q4
20
8 808 
150
6 397 
2023 Q3
24
9 496 
240
6 758 
2023 Q2
17
8 596 
208
6 914 
2023 Q1
17
9 423 
242
6 915 
2022 Q4
28
10 282 
238
7 186 
2022 Q3
40
8 752 
306
7 157 
2022 Q2
34
9 085 
300
7 119 
2022 Q1
25
9 659 
226
7 224 
2021 Q4
34
9 312 
253
7 160 
2021 Q3
43
9 408 
340
7 378 
2021 Q2
33
9 524 
286
7 086 
2021 Q1
19
7 788 
240
6 864 
2020 Q4
27
8 421 
292
6 860 
2020 Q3
27
8 688 
229
6 572 
2020 Q2
25
8 789 
200
6 748 
2020 Q1
19
8 944 
216
6 522 
2019 Q4
33
7 879 
253
6 319 
2019 Q3
46
8 236 
312
6 429 
2019 Q2
32
8 326 
244
6 089 
2019 Q1
23
8 198 
234
6 094 
2018 Q4
37
7 219 
239
5 903 
2018 Q3
45
8 139 
296
6 090 
2018 Q2
22
7 040 
234
5 636 
2018 Q1
18
8 002 
197
5 946 
2017 Q4
25
7 492 
228
5 796 
2017 Q3
44
7 144 
315
5 875 
2017 Q2
26
6 502 
252
5 352 
2017 Q1
31
7 111 
280
5 382 
2016 Q4
25
7 202 
229
5 344 
2016 Q3
48
7 083 
331
5 405 
2016 Q2
34
6 232 
225
5 301 
2016 Q1
26
7 198 
192
5 202 
2015 Q4
16
6 782 
220
5 218 
2015 Q3
43
7 058 
279
5 375 
2015 Q2
19
6 813 
200
5 262 
2015 Q1
16
6 310 
148
5 120 
2014 Q4
20
7 964 
171
5 444 
2014 Q3
36
6 700 
247
5 517 
2014 Q2
26
6 982 
215
5 464 
2014 Q1
24
6 488 
177
5 316 

Overview of the latest real estate transactions

The following list is an anonymized overview of the latest transactions. For more details and to find all transactions, please use the map to view transactions by plot or the transaction search page for a search by criteria.

2025-06-30
27 000 
Sale
1 outbuilding
2025-06-30
28 000 
Sale
1 outbuilding
2025-06-30
742 640 
5 757  /m²(129 m²)
Sale
Apartments
Apartment
1 room
18 m2
Apartments
Apartment
5 rooms
111 m2
2 outbuildings
2025-06-30
100 000 
6 250  /m²(16 m²)
Sale
Apartments
Apartment
1 room
16 m2
2025-06-30
410 000 
5 857  /m²(70 m²)
Sale
Commercial property
70 m2
2025-06-30
427 000 
6 014  /m²(71 m²)
Sale
Apartments
Apartment
3 rooms
71 m2
2 outbuildings
2025-06-30
879 000 
7 205  /m²(122 m²)
Sale
Apartments
Apartment
5 rooms
122 m2
2 outbuildings
2025-06-30
799 000 
6 829  /m²(117 m²)
Sale
Houses
House
5 rooms
117 m2
Land
424 m2
-Sols
2025-06-30
335 000 
4 188  /m²(80 m²)
Sale
Commercial property
80 m2
2025-06-27
356 500 
3 241  /m²(110 m²)
5 093  /m²(70 m²)
Sale
Apartments
Apartment
2 rooms
70 m2
Commercial property
40 m2
2025-06-27
204 000 
6 800  /m²(30 m²)
Sale
Apartments
Apartment
2 rooms
30 m2
1 outbuilding
2025-06-27
710 000 
7 802  /m²(91 m²)
Sale
Apartments
Apartment
3 rooms
91 m2
2 outbuildings
2025-06-27
787 970 
7 035  /m²(112 m²)
Sale
Apartments
Apartment
5 rooms
112 m2
3 outbuildings
2025-06-27
110 000 
9 167  /m²(12 m²)
Sale
Apartments
Apartment
1 room
12 m2
2025-06-27
430 000 
6 143  /m²(70 m²)
Sale
Apartments
Apartment
3 rooms
70 m2
2 outbuildings
2025-06-26
100 000 
3 125  /m²(32 m²)
Sale
Apartments
Apartment
1 room
32 m2
2 outbuildings
2025-06-26
127 000 
Sale
1 outbuilding
2025-06-26
485 000 
5 915  /m²(82 m²)
Sale
Apartments
Apartment
3 rooms
82 m2
3 outbuildings
2025-06-25
914 550 
7 435  /m²(123 m²)
Sale
Apartments
Apartment
4 rooms
123 m2
1 outbuilding
2025-06-25
641 090 
7 369  /m²(87 m²)
Sale
Apartments
Apartment
4 rooms
87 m2
1 outbuilding
15707 transactions listed in the municipality

Yvelines (78)

Most expensive cities

City
name
Descending orderHouses
house
Price per m²
7 960 
7 952 
7 768 
7 675 
6 913 
6 748 
6 318 
City
name
Descending orderApartments
apt.
Price per m²
6 192 
5 628 
5 254 
5 250 
5 153 
5 098 
5 056 

Least expensive cities

City
name
Ascending orderHouses
house
Price per m²
1 871 
1 903 
1 953 
1 997 
2 143 
2 192 
2 238 
2 250 
2 254 
City
name
Ascending orderApartments
apt.
Price per m²
729 
1 274 
1 500 
1 526 
1 578 
1 594 
1 675 
1 710