emooki
HomePrice mapTransactions
🇬🇧 English🇫🇷 Français🇩🇪 Deutsch🇪🇸 Español🇮🇹 Italiano

Real estate price map


Real estate price map in the municipality of Fontenay-le-Fleury, choose a section to see transactions by parcel.

Yvelines (78)

Fontenay-le-Fleury - Real estate price m²

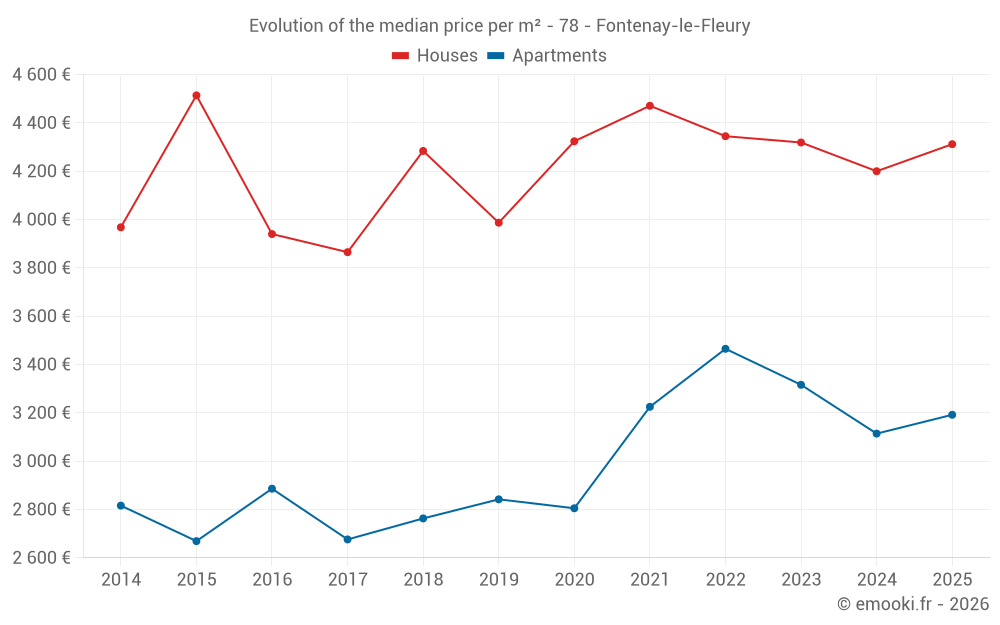
Median price of real estate
in the municipality of Fontenay-le-Fleury

HousesHouses
4 252  /m²
1-23-45-67-89-10
Reliability 8/10
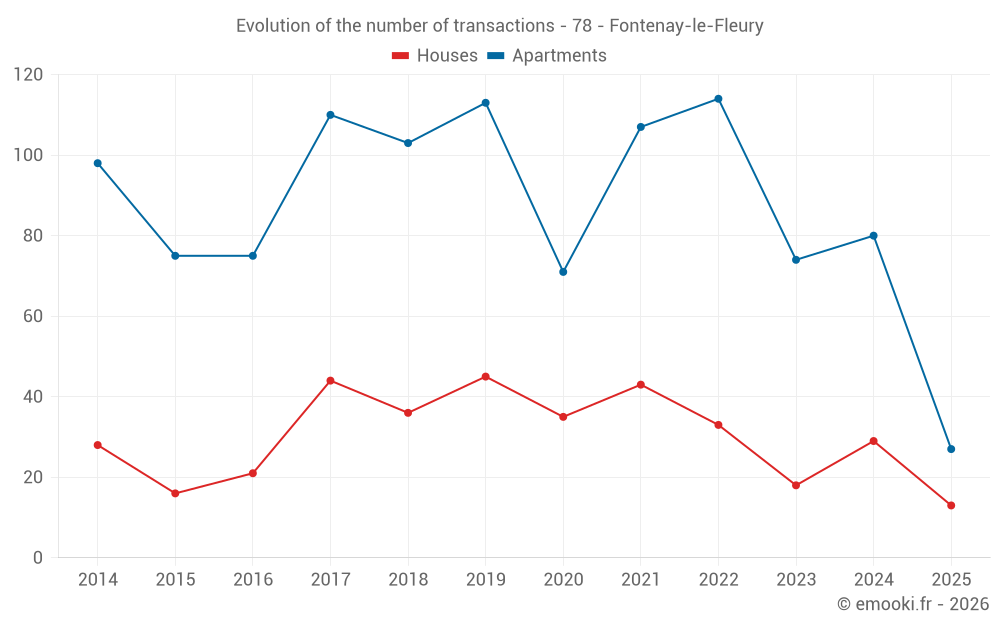
Median price on the 31 transactions of the last 12 months.
from 3 471 to
5 397  /m²
60% of transactions from the 2nd to the 8th deciles.
ApartmentsApartments
3 192  /m²
1-23-45-67-89-10
Reliability 9/10
Median price on the 27 transactions of the last 6 months.
from 2 403 to
3 764  /m²
60% of transactions from the 2nd to the 8th deciles.
DwellingsDwellings
3 438  /m²
1-23-45-67-89-10
Reliability 9/10
Median price on the 40 transactions of the last 6 months.
from 2 853 to
4 440  /m²
60% of transactions from the 2nd to the 8th deciles.
HousesEvolution of the price per m² of houses since...
1 year
+2.7%
2 years
-0.2%
3 years
-0.8%
4 years
-3.6%
5 years
-0.3%
6 years
+8.2%
7 years
+0.7%
8 years
+12%
9 years
+9.4%
10 years
-4.5%
11 years
+8.7%
The price per m² of houses has increased by 12% since 8 years, but it has decreased by 4.5% in 10 years.
ApartmentsEvolution of the price per m² of apartments since...
1 year
+2.5%
2 years
-3.7%
3 years
-7.9%
4 years
-1%
5 years
+14%
6 years
+12%
7 years
+16%
8 years
+19%
9 years
+11%
10 years
+20%
11 years
+13%
The price per m² of apartments has decreased by 7.9% since 3 years, but it has increased by 20% in 10 years.

Yearly evolution

Evolution of the median price per m²

Evolution of the median price per m² - 78 - Fontenay-le-Fleury

Evolution of the number of transactions

Warning, last year incomplete. Projections made based on the proportions between semesters of the previous year at the departmental/national level and by type of property.

Evolution of the number of transactions - 78 - Fontenay-le-Fleury

Yearly data

Descending order
Year
Houses
house
transactions
Houses
house
Price per m²
Apartments
apt.
transactions
Apartments
apt.
Price per m²
2025
13
4 312 
27
3 192 
2024
29
4 200 
80
3 114 
2023
18
4 319 
74
3 316 
2022
33
4 345 
114
3 465 
2021
43
4 471 
107
3 225 
2020
35
4 324 
71
2 805 
2019
45
3 987 
113
2 842 
2018
36
4 284 
103
2 763 
2017
44
3 865 
110
2 676 
2016
21
3 940 
75
2 886 
2015
16
4 514 
75
2 669 
2014
28
3 968 
98
2 816 

Analysis

Structure of prices per m²

Values of price percentiles per m² over the periods used for the estimated price of each type of property.

Structure of transaction amounts

Values of transaction amounts percentiles over the periods used for the estimated price of each type of property.

Transaction amounts and prices per m² by percentile

Ascending order
Percentile
Houses
house
Price per m²
Houses
house
Transaction amount
Apartments
apt.
Price per m²
Apartments
apt.
Transaction amount
10th percentile
3 266 
288 K
2 089 
95 160 
20th percentile
3 471 
329 K
2 403 
105 K
30th percentile
3 644 
345 K
2 853 
145 K
40th percentile
4 075 
380 K
3 026 
158 K
50th percentile
4 252 
387 K
3 192 
171 K
60th percentile
4 414 
407 K
3 332 
193 K
70th percentile
4 967 
443 K
3 515 
221 K
80th percentile
5 397 
492 K
3 764 
233 K
90th percentile
6 246 
552 K
4 399 
270 K

National and departmental comparison

Evolution of the median price per m² of houses

Evolution of the median price per m² of apartments

Quarterly evolution

Evolution of the median price per m²

Evolution of the number of transactions

Quarterly data

Descending order
Quarter
Houses
house
transactions
Houses
house
Price per m²
Apartments
apt.
transactions
Apartments
apt.
Price per m²
2025 Q2
5
4 312 
10
3 069 
2025 Q1
8
4 350 
17
3 320 
2024 Q4
12
4 076 
16
3 526 
2024 Q3
6
3 635 
27
3 055 
2024 Q2
5
4 200 
24
2 618 
2024 Q1
6
4 390 
13
3 311 
2023 Q4
2
4 498 
18
3 712 
2023 Q3
5
4 366 
15
3 452 
2023 Q2
5
4 428 
21
3 293 
2023 Q1
6
4 048 
20
3 285 
2022 Q4
6
4 156 
26
3 362 
2022 Q3
10
4 926 
32
3 542 
2022 Q2
8
4 318 
35
3 585 
2022 Q1
9
4 226 
21
3 038 
2021 Q4
6
4 668 
25
3 387 
2021 Q3
15
4 383 
33
3 256 
2021 Q2
9
4 627 
27
3 108 
2021 Q1
13
3 976 
22
3 261 
2020 Q4
10
4 450 
11
2 805 
2020 Q3
10
4 347 
17
3 332 
2020 Q2
7
4 375 
23
2 750 
2020 Q1
8
4 020 
20
2 466 
2019 Q4
11
4 684 
27
3 114 
2019 Q3
8
3 642 
29
2 676 
2019 Q2
13
3 571 
35
2 923 
2019 Q1
13
3 995 
22
2 807 
2018 Q4
6
4 815 
31
3 213 
2018 Q3
14
3 740 
30
2 726 
2018 Q2
8
4 028 
20
2 770 
2018 Q1
8
6 188 
22
2 574 
2017 Q4
14
4 176 
32
2 646 
2017 Q3
12
3 823 
28
2 601 
2017 Q2
9
4 032 
29
2 646 
2017 Q1
9
3 821 
21
2 857 
2016 Q4
7
4 043 
17
2 598 
2016 Q3
7
3 810 
32
2 658 
2016 Q2
4
3 498 
10
3 462 
2016 Q1
3
4 111 
16
3 028 
2015 Q4
2
4 658 
14
2 380 
2015 Q3
7
4 636 
25
2 778 
2015 Q2
4
4 368 
15
2 938 
2015 Q1
3
3 598 
21
2 560 
2014 Q4
10
3 828 
34
2 622 
2014 Q3
8
4 140 
20
2 894 
2014 Q2
4
4 440 
25
2 978 
2014 Q1
6
3 704 
19
2 857 

Overview of the latest real estate transactions

The following list is an anonymized overview of the latest transactions. For more details and to find all transactions, please use the map to view transactions by plot or the transaction search page for a search by criteria.

2025-06-25
234 000 
2 962  /m²(79 m²)
Sale
Apartments
Apartment
4 rooms
79 m2
2 outbuildings
2025-06-19
83 000 
3 192  /m²(26 m²)
Sale
Apartments
Apartment
1 room
26 m2
1 outbuilding
2025-06-18
90 900 
1 976  /m²(46 m²)
Sale
Apartments
Apartment
2 rooms
46 m2
1 outbuilding
2025-06-17
406 650 
3 081  /m²(132 m²)
Sale
Houses
House
5 rooms
132 m2
1 outbuilding
Land
118 m2
-Sols
2025-06-13
452 000 
4 967  /m²(91 m²)
Sale
Houses
House
4 rooms
91 m2
Land
533 m2
-Sols
2025-06-12
56 000 
3 111  /m²(18 m²)
Sale
Apartments
Apartment
1 room
18 m2
4 outbuildings
2025-06-10
269 700 
3 414  /m²(79 m²)
Sale
1 outbuilding
Apartments
Apartment
4 rooms
79 m2
1 outbuilding
2025-06-02
348 700 
4 252  /m²(82 m²)
Sale
Houses
House
4 rooms
82 m2
1 outbuilding
2025-05-23
100 000 
1 786  /m²(56 m²)
Sale
1 outbuilding
Apartments
Apartment
2 rooms
56 m2
1 outbuilding
2025-05-02
418 265 
4 312  /m²(97 m²)
Sale
Houses
House
5 rooms
97 m2
2025-05-02
170 940 
2 164  /m²(79 m²)
Sale
Apartments
Apartment
4 rooms
79 m2
2 outbuildings
2025-04-30
224 000 
3 027  /m²(74 m²)
Sale
Apartments
Apartment
5 rooms
74 m2
2025-04-23
345 000 
4 600  /m²(75 m²)
Sale
Houses
House
5 rooms
75 m2
1 outbuilding
Land
283 m2
-Sols
Land
166 m2
-Sols
2025-04-09
98 000 
3 769  /m²(26 m²)
Sale
Apartments
Apartment
1 room
26 m2
1 outbuilding
2025-04-08
116 000 
3 742  /m²(31 m²)
Sale
Apartments
Apartment
1 room
31 m2
1 outbuilding
2025-04-01
1 
Sale
Land
657 m2
-Sols
Land
9609 m2
-Sols
2025-03-18
205 000 
5 256  /m²(39 m²)
Sale
Apartments
Apartment
2 rooms
39 m2
1 outbuilding
2025-03-18
230 000 
2 347  /m²(98 m²)
Sale
Apartments
Apartment
5 rooms
98 m2
1 outbuilding
2 outbuildings
2025-03-14
138 000 
3 209  /m²(43 m²)
Sale
Apartments
Apartment
2 rooms
43 m2
2025-03-12
199 000 
2 843  /m²(70 m²)
Sale
Apartments
Apartment
4 rooms
70 m2
2 outbuildings
1936 transactions listed in the municipality

Yvelines (78)

Most expensive cities

City
name
Descending orderHouses
house
Price per m²
7 960 
7 952 
7 768 
7 675 
6 913 
6 748 
6 318 
City
name
Descending orderApartments
apt.
Price per m²
6 192 
5 628 
5 254 
5 250 
5 153 
5 098 
5 056 

Least expensive cities

City
name
Ascending orderHouses
house
Price per m²
1 871 
1 903 
1 953 
1 997 
2 143 
2 192 
2 238 
2 250 
2 254 
City
name
Ascending orderApartments
apt.
Price per m²
729 
1 274 
1 500 
1 526 
1 578 
1 594 
1 675 
1 710