Median price of real estate
in the municipality of Marly-le-Roi
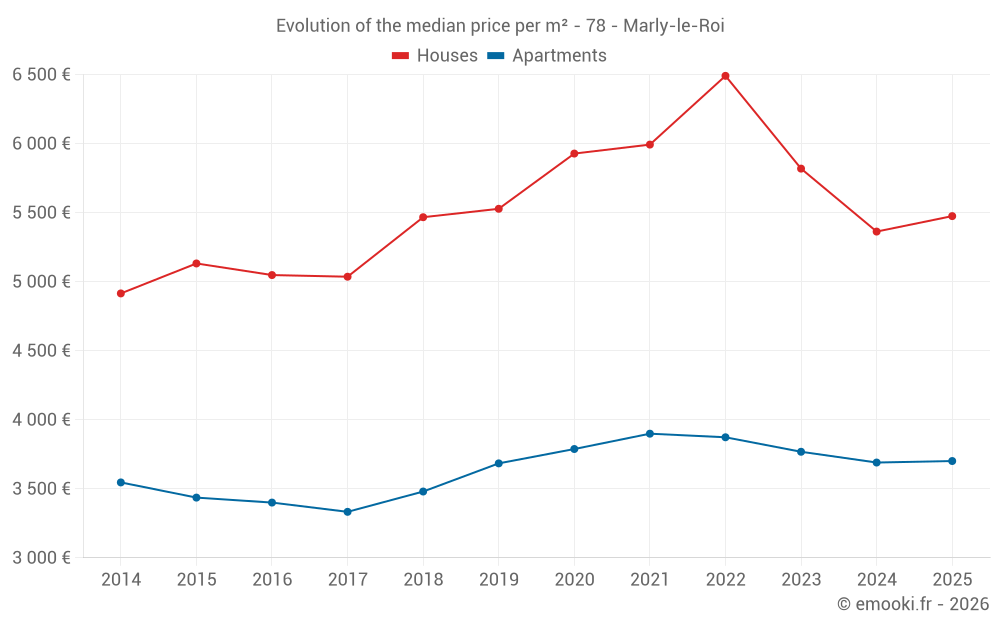
Houses
5 475 € /m²
Reliability 9/10
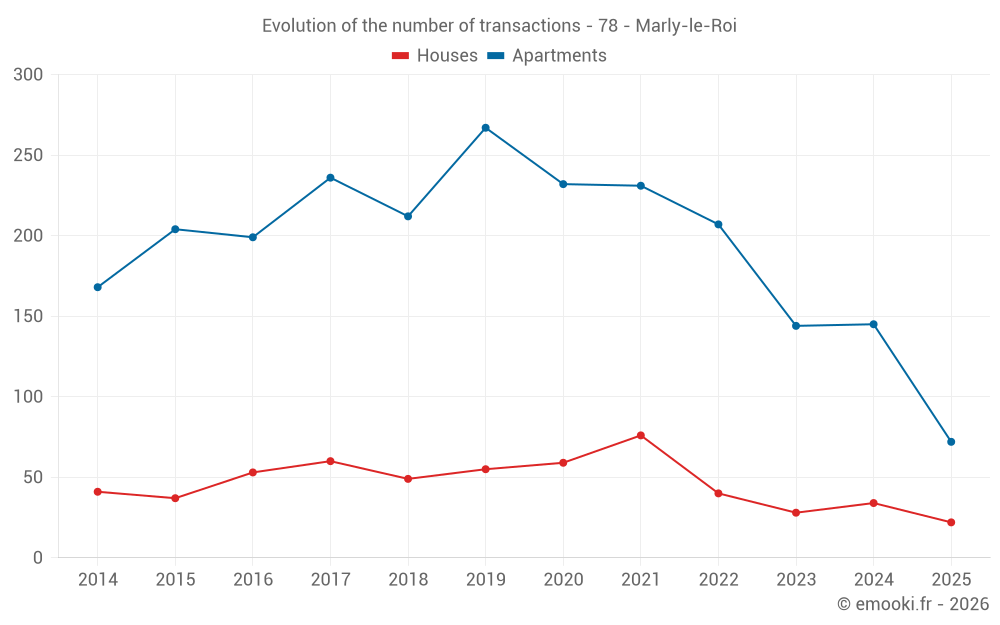
Median price on the 22 transactions of the last 6 months.
from 4 748 to
6 453 € /m²
6 453 € /m²
60% of transactions from the 2nd to the 8th deciles.
Apartments
3 734 € /m²
Reliability 10/10
Median price on the 36 transactions of the last 3 months.
from 3 333 to
4 132 € /m²
4 132 € /m²
60% of transactions from the 2nd to the 8th deciles.
Dwellings
3 922 € /m²
Reliability 10/10
Median price on the 46 transactions of the last 3 months.
from 3 381 to
4 740 € /m²
4 740 € /m²
60% of transactions from the 2nd to the 8th deciles.