emooki
HomePrice mapTransactions
🇬🇧 English🇫🇷 Français🇩🇪 Deutsch🇪🇸 Español🇮🇹 Italiano

Real estate price map


Real estate price map in the municipality of Oissery, choose a section to see transactions by parcel.

Seine-et-Marne (77)

Oissery - Real estate price m²

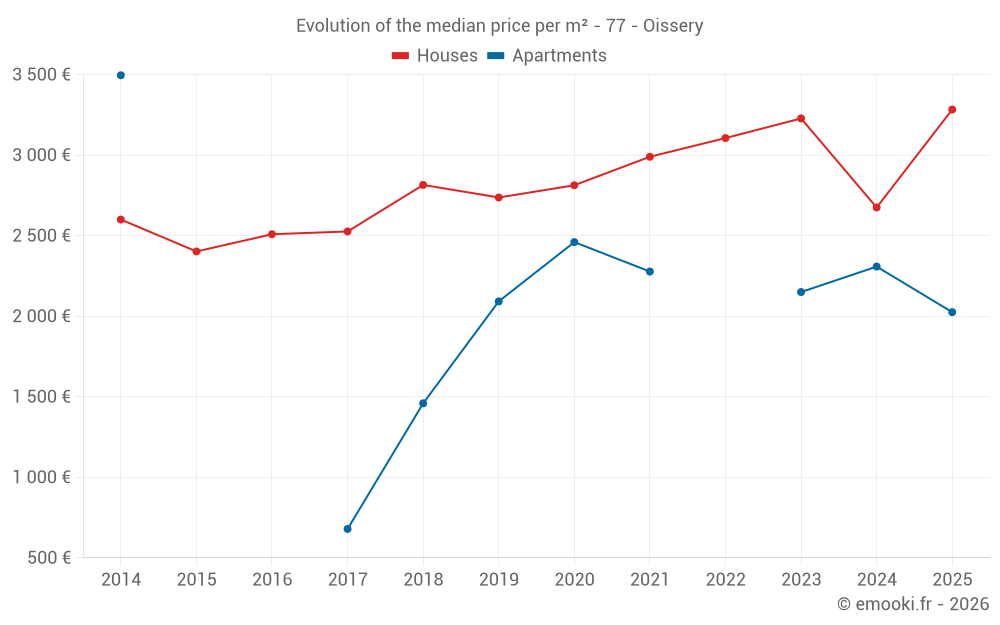
Median price of real estate
in the municipality of Oissery

HousesHouses
3 157  /m²
1-23-45-67-89-10
Reliability 8/10
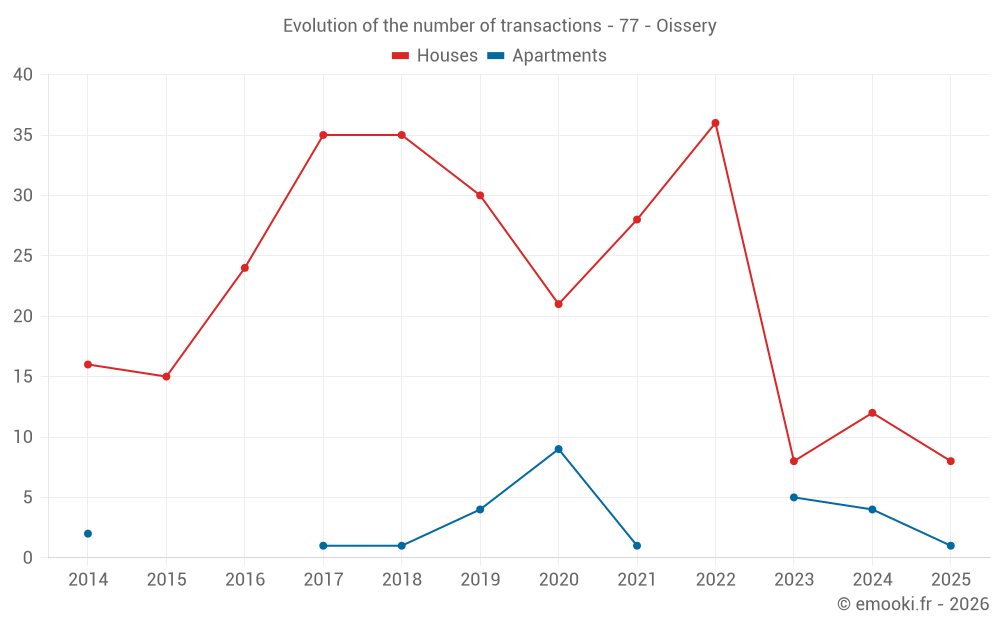
Median price on the 17 transactions of the last 12 months.
from 2 205 to
3 830  /m²
60% of transactions from the 2nd to the 8th deciles.
ApartmentsApartments
2 204  /m²
1-23-45-67-89-10
Reliability 5/10
Median price on the 11 transactions of the last 48 months.
from 2 048 to
2 441  /m²
60% of transactions from the 2nd to the 8th deciles.
DwellingsDwellings
2 550  /m²
1-23-45-67-89-10
Reliability 8/10
Median price on the 22 transactions of the last 12 months.
from 2 104 to
3 517  /m²
60% of transactions from the 2nd to the 8th deciles.
HousesEvolution of the price per m² of houses since...
1 year
+23%
2 years
+1.7%
3 years
+5.7%
4 years
+10%
5 years
+17%
6 years
+20%
7 years
+17%
8 years
+30%
9 years
+31%
10 years
+37%
11 years
+26%

Yearly evolution

Evolution of the median price per m²

Evolution of the median price per m² - 77 - Oissery

Evolution of the number of transactions

Warning, last year incomplete. Projections made based on the proportions between semesters of the previous year at the departmental/national level and by type of property.

Evolution of the number of transactions - 77 - Oissery

Yearly data

Descending order
Year
Houses
house
transactions
Houses
house
Price per m²
Apartments
apt.
transactions
Apartments
apt.
Price per m²
2025
8
3 283 
1
2 025 
2024
12
2 675 
4
2 308 
2023
8
3 228 
5
2 150 
2022
36
3 106 
0
--- 
2021
28
2 990 
1
2 277 
2020
21
2 813 
9
2 460 
2019
30
2 737 
4
2 092 
2018
35
2 815 
1
1 459 
2017
35
2 526 
1
679 
2016
24
2 509 
0
--- 
2015
15
2 402 
0
--- 
2014
16
2 600 
2
3 496 

Analysis

Structure of prices per m²

Values of price percentiles per m² over the periods used for the estimated price of each type of property.

Structure of transaction amounts

Values of transaction amounts percentiles over the periods used for the estimated price of each type of property.

Transaction amounts and prices per m² by percentile

Ascending order
Percentile
Houses
house
Price per m²
Houses
house
Transaction amount
Apartments
apt.
Price per m²
Apartments
apt.
Transaction amount
10th percentile
1 991 
248 K
2 025 
125 K
20th percentile
2 205 
251 K
2 048 
129 K
30th percentile
2 318 
260 K
2 083 
129 K
40th percentile
2 672 
289 K
2 150 
129 K
50th percentile
3 157 
303 K
2 204 
135 K
60th percentile
3 405 
310 K
2 277 
144 K
70th percentile
3 486 
319 K
2 411 
160 K
80th percentile
3 830 
339 K
2 441 
169 K
90th percentile
3 943 
350 K
2 600 
200 K

National and departmental comparison

Evolution of the median price per m² of houses

Evolution of the median price per m² of apartments

Quarterly evolution

Evolution of the median price per m²

Evolution of the number of transactions

Quarterly data

Descending order
Quarter
Houses
house
transactions
Houses
house
Price per m²
Apartments
apt.
transactions
Apartments
apt.
Price per m²
2025 Q2
2
2 301 
0
--- 
2025 Q1
6
3 442 
1
2 025 
2024 Q4
5
2 658 
4
2 308 
2024 Q3
4
3 940 
0
--- 
2024 Q2
2
2 558 
0
--- 
2024 Q1
1
1 750 
0
--- 
2023 Q4
1
2 679 
1
2 857 
2023 Q3
3
2 990 
4
2 099 
2023 Q2
1
2 816 
0
--- 
2023 Q1
3
3 500 
0
--- 
2022 Q4
8
2 930 
0
--- 
2022 Q3
13
3 431 
0
--- 
2022 Q2
10
3 086 
0
--- 
2022 Q1
5
3 099 
0
--- 
2021 Q4
4
3 488 
1
2 277 
2021 Q3
8
3 090 
0
--- 
2021 Q2
10
2 942 
0
--- 
2021 Q1
6
2 710 
0
--- 
2020 Q4
4
3 667 
2
2 216 
2020 Q3
7
2 882 
5
2 500 
2020 Q2
5
2 571 
0
--- 
2020 Q1
5
2 613 
2
2 238 
2019 Q4
10
2 546 
2
2 306 
2019 Q3
7
3 356 
0
--- 
2019 Q2
6
2 672 
2
2 042 
2019 Q1
7
2 764 
0
--- 
2018 Q4
5
2 906 
1
1 459 
2018 Q3
16
3 042 
0
--- 
2018 Q2
10
2 434 
0
--- 
2018 Q1
4
2 372 
0
--- 
2017 Q4
5
2 031 
1
679 
2017 Q3
13
2 545 
0
--- 
2017 Q2
10
2 706 
0
--- 
2017 Q1
7
2 526 
0
--- 
2016 Q4
5
2 595 
0
--- 
2016 Q3
7
2 286 
0
--- 
2016 Q2
9
2 468 
0
--- 
2016 Q1
3
1 985 
0
--- 
2015 Q4
4
2 474 
0
--- 
2015 Q3
3
2 328 
0
--- 
2015 Q2
2
3 034 
0
--- 
2015 Q1
6
2 282 
0
--- 
2014 Q4
5
3 105 
1
4 933 
2014 Q3
4
2 478 
0
--- 
2014 Q2
2
2 624 
0
--- 
2014 Q1
5
2 411 
1
2 059 

Overview of the latest real estate transactions

The following list is an anonymized overview of the latest transactions. For more details and to find all transactions, please use the map to view transactions by plot or the transaction search page for a search by criteria.

2025-05-28
250 000 
2 273  /m²(110 m²)
Sale
Houses
House
4 rooms
110 m2
2 outbuildings
Land
355 m2
-Sols
Land
635 m2
-Jardins
/Jardin potager
2025-05-20
340 000 
2 329  /m²(146 m²)
Sale
Houses
House
4 rooms
146 m2
Land
500 m2
-Sols
Land
400 m2
-Jardins
/Jardin potager
Land
463 m2
-Jardins
/Jardin potager
2025-03-31
364 000 
1 978  /m²(184 m²)
Sale
Houses
House
8 rooms
184 m2
1 outbuilding
Land
308 m2
-Jardins
/Jardin potager
Land
500 m2
-Sols
Land
460 m2
-Jardins
/Jardin potager
2025-02-28
365 000 
3 476  /m²(105 m²)
Sale
Houses
House
4 rooms
105 m2
Land
321 m2
-Jardins
/Jardin potager
Land
500 m2
-Sols
2025-02-19
160 000 
2 025  /m²(79 m²)
Sale
Apartments
Apartment
4 rooms
79 m2
2 outbuildings
2025-02-14
300 000 
3 409  /m²(88 m²)
Sale
Houses
House
4 rooms
88 m2
Land
500 m2
-Sols
Land
203 m2
-Jardins
/Jardin potager
2025-02-14
281 000 
3 157  /m²(89 m²)
Sale
Houses
House
5 rooms
89 m2
1 outbuilding
Land
610 m2
-Sols
2025-01-23
261 000 
3 527  /m²(74 m²)
Sale
Houses
House
5 rooms
74 m2
Land
680 m2
-Sols
2025-01-16
200 000 
3 922  /m²(51 m²)
Sale
Land
25 m2
-Sols
Houses
House
3 rooms
51 m2
Land
320 m2
-Sols
Land
206 m2
-Sols
2024-12-17
245 000 
2 188  /m²(112 m²)
Sale
Houses
House
5 rooms
112 m2
1 outbuilding
Land
265 m2
-Jardins
/Jardin potager
Land
500 m2
-Sols
2024-12-16
90 000 
Sale
Land
268 m2
-Terrains à bâtir
2024-12-02
119 000 
2 204  /m²(54 m²)
Sale
Apartments
Apartment
3 rooms
54 m2
1 outbuilding
2024-11-26
303 000 
2 658  /m²(114 m²)
Sale
Houses
House
4 rooms
114 m2
1 outbuilding
Land
500 m2
-Sols
Land
275 m2
-Jardins
/Jardin potager
2024-11-22
340 000 
2 000  /m²(170 m²)
Sale
Houses
House
5 rooms
170 m2
1 outbuilding
Land
3332 m2
-Vergers
/Verger exploite en hautes tiges
Land
2134 m2
-Sols
2024-11-22
165 000 
Sale
Land
6334 m2
-Terres
Land
57412 m2
-Terres
Land
57413 m2
-Terres
2024-11-22
150 000 
Sale
Land
11981 m2
-Sols
2024-11-22
200 000 
Sale
Land
2566 m2
-Sols
2024-11-07
125 000 
2 083  /m²(60 m²)
Sale
Apartments
Apartment
3 rooms
60 m2
2 outbuildings
2024-10-28
144 000 
2 441  /m²(59 m²)
Sale
Apartments
Apartment
3 rooms
59 m2
2 outbuildings
2024-10-10
135 000 
2 411  /m²(56 m²)
Sale
Apartments
Apartment
3 rooms
56 m2
2 outbuildings
423 transactions listed in the municipality

Seine-et-Marne (77)

Most expensive cities

City
name
Descending orderHouses
house
Price per m²
5 573 
4 928 
4 680 
4 436 
4 277 
4 214 
4 098 
City
name
Descending orderApartments
apt.
Price per m²
64 397 
10 818 
4 800 
4 625 
4 584 
4 574 
4 430 

Least expensive cities

City
name
Ascending orderHouses
house
Price per m²
1 052 
1 280 
1 330 
1 338 
1 341 
1 406 
City
name
Ascending orderApartments
apt.
Price per m²
580 
675 
682