emooki
HomePrice mapTransactions
🇬🇧 English🇫🇷 Français🇩🇪 Deutsch🇪🇸 Español🇮🇹 Italiano

Real estate price map


Real estate price map in the municipality of Le Plessis-Belleville, choose a section to see transactions by parcel.

Oise (60)

Le Plessis-Belleville - Real estate price m²

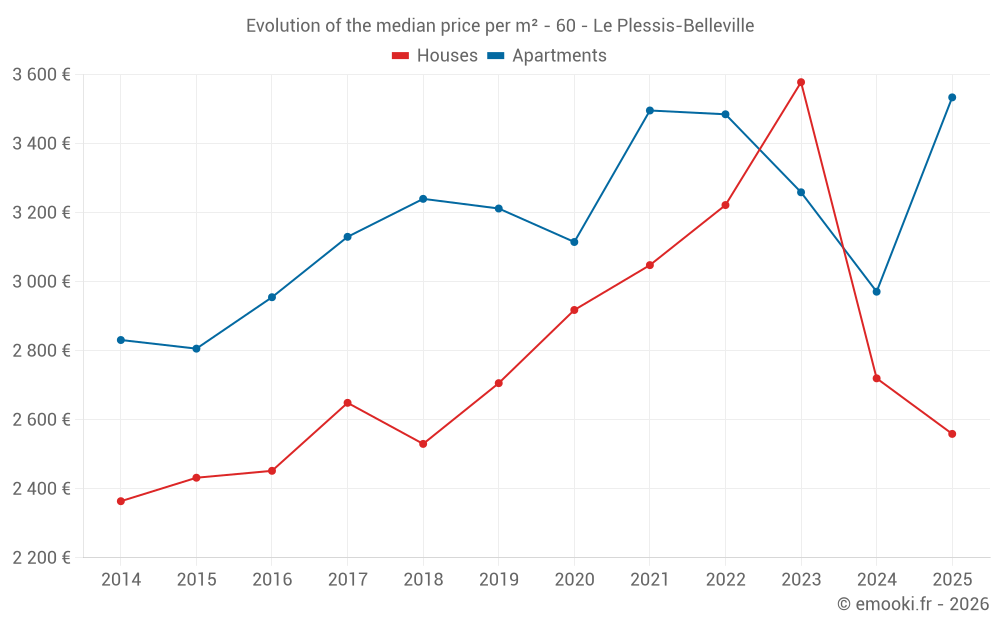
Median price of real estate
in the municipality of Le Plessis-Belleville

HousesHouses
2 567  /m²
1-23-45-67-89-10
Reliability 8/10
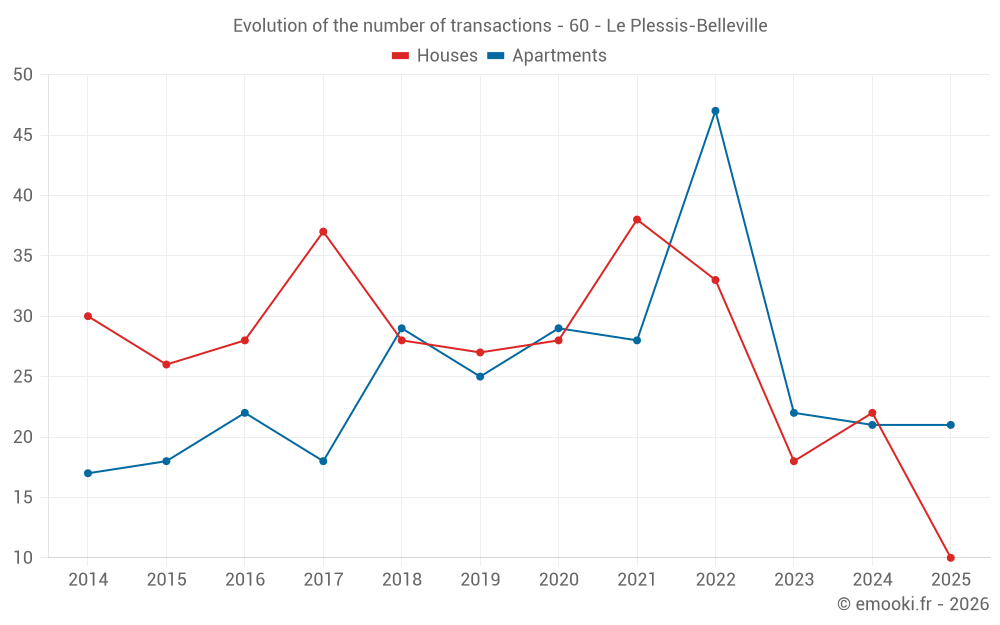
Median price on the 23 transactions of the last 12 months.
from 2 254 to
3 527  /m²
60% of transactions from the 2nd to the 8th deciles.
ApartmentsApartments
3 534  /m²
1-23-45-67-89-10
Reliability 9/10
Median price on the 21 transactions of the last 6 months.
from 2 826 to
3 776  /m²
60% of transactions from the 2nd to the 8th deciles.
DwellingsDwellings
3 029  /m²
1-23-45-67-89-10
Reliability 9/10
Median price on the 31 transactions of the last 6 months.
from 2 551 to
3 776  /m²
60% of transactions from the 2nd to the 8th deciles.
HousesEvolution of the price per m² of houses since...
1 year
-5.9%
2 years
-28%
3 years
-21%
4 years
-16%
5 years
-12%
6 years
-5.4%
7 years
+1.1%
8 years
-3.4%
9 years
+4.4%
10 years
+5.2%
11 years
+8.2%
The price per m² of houses has decreased by 28% since 2 years, but it has increased by 8.2% in 11 years.
ApartmentsEvolution of the price per m² of apartments since...
1 year
+19%
2 years
+8.4%
3 years
+1.4%
4 years
+1.1%
5 years
+13%
6 years
+10%
7 years
+9.1%
8 years
+13%
9 years
+20%
10 years
+26%
11 years
+25%

Yearly evolution

Evolution of the median price per m²

Evolution of the median price per m² - 60 - Le Plessis-Belleville

Evolution of the number of transactions

Warning, last year incomplete. Projections made based on the proportions between semesters of the previous year at the departmental/national level and by type of property.

Evolution of the number of transactions - 60 - Le Plessis-Belleville

Yearly data

Descending order
Year
Houses
house
transactions
Houses
house
Price per m²
Apartments
apt.
transactions
Apartments
apt.
Price per m²
2025
10
2 559 
21
3 534 
2024
22
2 720 
21
2 971 
2023
18
3 578 
22
3 259 
2022
33
3 222 
47
3 485 
2021
38
3 048 
28
3 496 
2020
28
2 918 
29
3 115 
2019
27
2 706 
25
3 212 
2018
28
2 530 
29
3 240 
2017
37
2 649 
18
3 130 
2016
28
2 452 
22
2 955 
2015
26
2 432 
18
2 806 
2014
30
2 364 
17
2 831 

Analysis

Structure of prices per m²

Values of price percentiles per m² over the periods used for the estimated price of each type of property.

Structure of transaction amounts

Values of transaction amounts percentiles over the periods used for the estimated price of each type of property.

Transaction amounts and prices per m² by percentile

Ascending order
Percentile
Houses
house
Price per m²
Houses
house
Transaction amount
Apartments
apt.
Price per m²
Apartments
apt.
Transaction amount
10th percentile
1 896 
135 K
2 609 
109 K
20th percentile
2 254 
232 K
2 826 
135 K
30th percentile
2 475 
241 K
3 000 
136 K
40th percentile
2 540 
249 K
3 406 
166 K
50th percentile
2 567 
250 K
3 534 
170 K
60th percentile
2 822 
295 K
3 652 
175 K
70th percentile
2 978 
340 K
3 768 
180 K
80th percentile
3 527 
393 K
3 776 
205 K
90th percentile
3 739 
400 K
3 967 
205 K

National and departmental comparison

Evolution of the median price per m² of houses

Evolution of the median price per m² of apartments

Quarterly evolution

Evolution of the median price per m²

Evolution of the number of transactions

Quarterly data

Descending order
Quarter
Houses
house
transactions
Houses
house
Price per m²
Apartments
apt.
transactions
Apartments
apt.
Price per m²
2025 Q2
3
2 805 
8
3 194 
2025 Q1
7
2 551 
13
3 652 
2024 Q4
9
2 475 
8
2 907 
2024 Q3
4
3 603 
4
3 226 
2024 Q2
4
3 027 
5
3 148 
2024 Q1
5
2 596 
4
3 020 
2023 Q4
3
3 030 
3
3 444 
2023 Q3
8
3 252 
4
3 484 
2023 Q2
1
3 000 
3
2 375 
2023 Q1
6
4 430 
12
3 072 
2022 Q4
5
2 525 
12
3 304 
2022 Q3
12
2 942 
14
3 381 
2022 Q2
11
3 506 
11
3 333 
2022 Q1
5
3 198 
10
3 723 
2021 Q4
8
3 336 
11
3 333 
2021 Q3
14
2 790 
7
3 750 
2021 Q2
11
3 115 
6
3 817 
2021 Q1
5
3 231 
4
3 098 
2020 Q4
9
2 875 
9
3 295 
2020 Q3
8
2 718 
5
3 081 
2020 Q2
6
3 481 
7
3 125 
2020 Q1
5
3 333 
8
2 983 
2019 Q4
13
2 600 
5
2 955 
2019 Q3
8
2 742 
11
3 400 
2019 Q2
3
2 787 
5
3 212 
2019 Q1
3
3 049 
4
3 396 
2018 Q4
7
2 560 
5
3 429 
2018 Q3
9
2 603 
7
2 811 
2018 Q2
7
2 500 
11
3 240 
2018 Q1
5
2 252 
6
3 102 
2017 Q4
10
2 668 
2
3 448 
2017 Q3
10
2 826 
5
3 213 
2017 Q2
7
2 794 
9
3 074 
2017 Q1
10
2 576 
2
3 420 
2016 Q4
10
2 316 
9
2 819 
2016 Q3
5
2 322 
6
3 070 
2016 Q2
7
2 632 
2
2 814 
2016 Q1
6
2 518 
5
3 023 
2015 Q4
8
2 432 
5
2 778 
2015 Q3
8
2 376 
3
2 959 
2015 Q2
4
2 396 
3
2 761 
2015 Q1
6
2 776 
7
2 798 
2014 Q4
3
3 333 
5
2 831 
2014 Q3
12
2 218 
4
2 450 
2014 Q2
6
2 028 
3
2 643 
2014 Q1
9
2 789 
5
3 136 

Overview of the latest real estate transactions

The following list is an anonymized overview of the latest transactions. For more details and to find all transactions, please use the map to view transactions by plot or the transaction search page for a search by criteria.

2025-06-30
95 000 
2 375  /m²(40 m²)
Sale
Apartments
Apartment
2 rooms
40 m2
2 outbuildings
2025-06-27
130 000 
2 826  /m²(46 m²)
Sale
Apartments
Apartment
2 rooms
46 m2
1 outbuilding
2025-06-18
253 000 
3 776  /m²(67 m²)
Sale
Apartments
Apartment
4 rooms
67 m2
1 outbuilding
2025-06-09
289 950 
3 766  /m²(77 m²)
Sale
Houses
House
4 rooms
77 m2
Land
298 m2
-Sols
2025-05-28
138 000 
Sale
Land
448 m2
-Terrains à bâtir
2025-05-26
166 000 
3 609  /m²(46 m²)
Sale
Apartments
Apartment
2 rooms
46 m2
1 outbuilding
2025-05-23
295 000 
500  /m²(590 m²)
Sale
Commercial property
590 m2
Land
761 m2
-Sols
2025-05-20
205 000 
2 971  /m²(69 m²)
Sale
Apartments
Apartment
2 rooms
69 m2
2 outbuildings
2025-05-12
205 000 
3 417  /m²(60 m²)
Sale
Apartments
Apartment
3 rooms
60 m2
1 outbuilding
2025-04-23
187 000 
2 429  /m²(77 m²)
Sale
Apartments
Apartment
4 rooms
77 m2
2 outbuildings
2025-04-18
219 000 
3 776  /m²(58 m²)
Sale
Apartments
Apartment
3 rooms
58 m2
1 outbuilding
2025-04-18
175 000 
1 620  /m²(108 m²)
Sale
Houses
House
3 rooms
54 m2
Houses
House
3 rooms
54 m2
2025-04-09
230 000 
2 805  /m²(82 m²)
Sale
Houses
House
2 rooms
20 m2
Houses
House
4 rooms
62 m2
Land
902 m2
-Sols
Land
29 m2
-Terres
2025-03-28
135 000 
3 000  /m²(45 m²)
Sale
Apartments
Apartment
2 rooms
45 m2
2 outbuildings
2025-03-28
117 000 
2 127  /m²(55 m²)
Sale
Houses
House
3 rooms
55 m2
1 outbuilding
Land
351 m2
-Sols
2025-03-25
43 175 
Sale
Land
216 m2
-Sols
Land
1511 m2
-Sols
2025-03-21
105 500 
3 768  /m²(28 m²)
Sale
1 outbuilding
Apartments
Apartment
1 room
28 m2
1 outbuilding
2025-03-19
125 000 
1 838  /m²(68 m²)
Sale
Houses
House
4 rooms
68 m2
1 outbuilding
Land
410 m2
-Sols
2025-03-07
6 200 
Sale
1 outbuilding
2025-03-06
247 000 
2 495  /m²(99 m²)
Sale
Houses
House
4 rooms
99 m2
Land
236 m2
-Sols
1157 transactions listed in the municipality

Oise (60)

Most expensive cities

City
name
Descending orderHouses
house
Price per m²
4 500 
4 036 
3 894 
3 828 
3 625 
3 603 
3 564 
City
name
Descending orderApartments
apt.
Price per m²
4 598 
4 036 
4 027 
3 876 
3 732 
3 704 
3 612 
3 500 
3 462 

Least expensive cities

City
name
Ascending orderHouses
house
Price per m²
330 
878 
920 
1 019 
1 031 
1 042 
1 049 
City
name
Ascending orderApartments
apt.
Price per m²
12 
184 
294 
333 
379 
500 
574