emooki
HomePrice mapTransactions
🇬🇧 English🇫🇷 Français🇩🇪 Deutsch🇪🇸 Español🇮🇹 Italiano

Real estate price map


Real estate price map in the municipality of Montagnole, choose a section to see transactions by parcel.

Savoie (73)

Montagnole - Real estate price m²

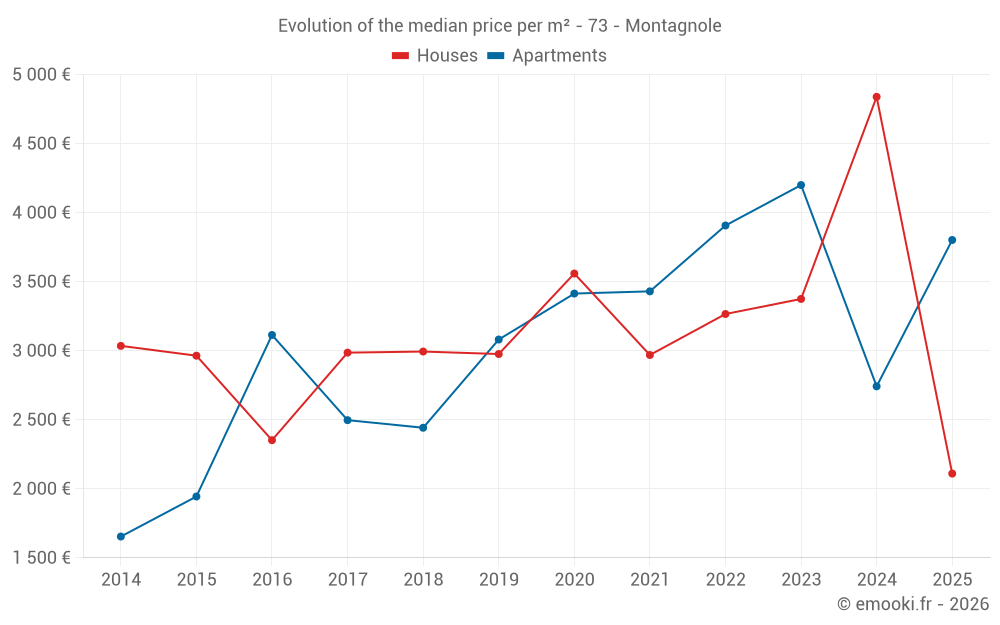
Median price of real estate
in the municipality of Montagnole

HousesHouses
3 391  /m²
1-23-45-67-89-10
Reliability 6/10
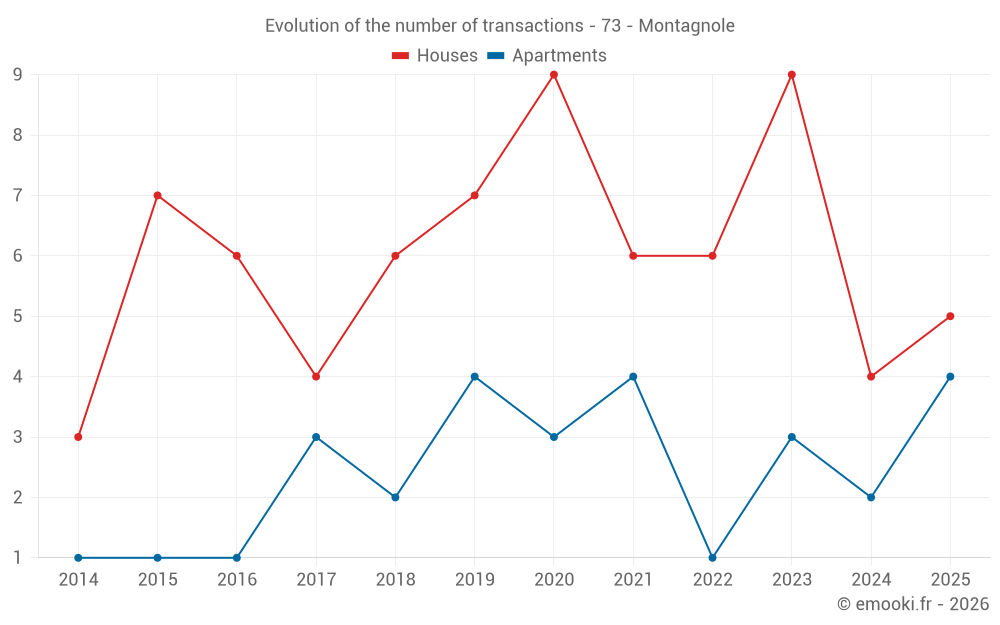
Median price on the 21 transactions of the last 36 months.
from 2 110 to
4 700  /m²
60% of transactions from the 2nd to the 8th deciles.
ApartmentsApartments
3 900  /m²
1-23-45-67-89-10
Reliability 5/10
Median price on the 13 transactions of the last 48 months.
from 2 640 to
4 168  /m²
60% of transactions from the 2nd to the 8th deciles.
DwellingsDwellings
3 974  /m²
1-23-45-67-89-10
Reliability 7/10
Median price on the 18 transactions of the last 24 months.
from 2 119 to
4 577  /m²
60% of transactions from the 2nd to the 8th deciles.
HousesEvolution of the price per m² of houses since...
1 year
-56%
2 years
-37%
3 years
-35%
4 years
-29%
5 years
-41%
6 years
-29%
7 years
-30%
8 years
-29%
9 years
-10%
10 years
-29%
11 years
--
ApartmentsEvolution of the price per m² of apartments since...
1 year
--
2 years
--
3 years
--
4 years
+11%
5 years
--
6 years
+23%
7 years
--
8 years
--
9 years
--
10 years
--
11 years
--

Yearly evolution

Evolution of the median price per m²

Evolution of the median price per m² - 73 - Montagnole

Evolution of the number of transactions

Warning, last year incomplete. Projections made based on the proportions between semesters of the previous year at the departmental/national level and by type of property.

Evolution of the number of transactions - 73 - Montagnole

Yearly data

Descending order
Year
Houses
house
transactions
Houses
house
Price per m²
Apartments
apt.
transactions
Apartments
apt.
Price per m²
2025
5
2 110 
4
3 802 
2024
4
4 839 
2
2 742 
2023
9
3 375 
3
4 200 
2022
6
3 266 
1
3 907 
2021
6
2 969 
4
3 430 
2020
9
3 559 
3
3 414 
2019
7
2 976 
4
3 081 
2018
6
2 994 
2
2 442 
2017
4
2 986 
3
2 497 
2016
6
2 352 
1
3 114 
2015
7
2 964 
1
1 944 
2014
3
3 035 
1
1 654 

Analysis

Structure of prices per m²

Values of price percentiles per m² over the periods used for the estimated price of each type of property.

Structure of transaction amounts

Values of transaction amounts percentiles over the periods used for the estimated price of each type of property.

Transaction amounts and prices per m² by percentile

Ascending order
Percentile
Houses
house
Price per m²
Houses
house
Transaction amount
Apartments
apt.
Price per m²
Apartments
apt.
Transaction amount
10th percentile
1 480 
140 K
1 920 
226 K
20th percentile
2 110 
219 K
2 640 
263 K
30th percentile
2 853 
280 K
3 522 
285 K
40th percentile
3 140 
430 K
3 641 
288 K
50th percentile
3 391 
470 K
3 900 
300 K
60th percentile
3 948 
476 K
3 926 
345 K
70th percentile
4 148 
589 K
4 048 
369 K
80th percentile
4 700 
680 K
4 168 
377 K
90th percentile
5 530 
710 K
4 354 
388 K

National and departmental comparison

Evolution of the median price per m² of houses

Evolution of the median price per m² of apartments

Quarterly evolution

Evolution of the median price per m²

Evolution of the number of transactions

Quarterly data

Descending order
Quarter
Houses
house
transactions
Houses
house
Price per m²
Apartments
apt.
transactions
Apartments
apt.
Price per m²
2025 Q2
2
3 156 
1
3 603 
2025 Q1
3
1 833 
3
4 001 
2024 Q4
2
5 046 
1
1 364 
2024 Q2
1
5 530 
0
--- 
2024 Q1
1
3 948 
1
4 119 
2023 Q4
2
4 792 
0
--- 
2023 Q3
1
3 821 
0
--- 
2023 Q2
3
1 480 
1
3 900 
2023 Q1
3
2 888 
2
4 414 
2022 Q3
3
3 391 
0
--- 
2022 Q2
2
3 831 
0
--- 
2022 Q1
1
8 
1
3 907 
2021 Q3
2
3 422 
3
3 401 
2021 Q2
2
5 237 
0
--- 
2021 Q1
2
2 018 
1
3 460 
2020 Q4
2
3 536 
2
3 180 
2020 Q3
3
3 723 
0
--- 
2020 Q2
3
2 339 
0
--- 
2020 Q1
1
3 368 
1
3 680 
2019 Q4
2
3 581 
0
--- 
2019 Q3
4
3 013 
1
1 626 
2019 Q2
1
2 807 
3
3 233 
2018 Q4
2
3 010 
1
2 330 
2018 Q3
1
2 831 
1
2 554 
2018 Q2
1
3 157 
0
--- 
2018 Q1
2
2 641 
0
--- 
2017 Q4
1
2 880 
1
2 497 
2017 Q2
2
3 251 
1
2 354 
2017 Q1
1
2 525 
1
2 950 
2016 Q4
1
2 635 
1
3 114 
2016 Q3
2
2 714 
0
--- 
2016 Q2
1
3 364 
0
--- 
2016 Q1
2
470 
0
--- 
2015 Q4
2
2 724 
0
--- 
2015 Q3
3
3 096 
1
1 944 
2015 Q1
2
2 696 
0
--- 
2014 Q3
2
2 945 
0
--- 
2014 Q1
1
3 500 
1
1 654 

Overview of the latest real estate transactions

The following list is an anonymized overview of the latest transactions. For more details and to find all transactions, please use the map to view transactions by plot or the transaction search page for a search by criteria.

2025-06-18
370 000 
2 313  /m²(160 m²)
Sale
Houses
House
7 rooms
160 m2
Land
821 m2
-Sols
2025-04-29
252 200 
3 603  /m²(70 m²)
Sale
Apartments
Apartment
3 rooms
70 m2
1 outbuilding
1 outbuilding
2025-04-17
650 000 
3 552  /m²(183 m²)
4 887  /m²(133 m²)
Sale
Houses
House
1 room
36 m2
Commercial property
50 m2
Land
155 m2
-Sols
Houses
House
2 rooms
97 m2
Land
5120 m2
-Prés
Land
1000 m2
-Terrains d'agrément
Land
500 m2
-Sols
2025-04-07
280 000 
4 000  /m²(70 m²)
Sale
Houses
House
4 rooms
70 m2
Land
1509 m2
-Sols
1 outbuilding
Land
100 m2
-Sols
Land
21949 m2
-Prés
Land
517 m2
-Jardins
2025-03-28
2 800 
Sale
Land
1420 m2
-Prés
Land
1210 m2
-Prés
2025-03-27
288 000 
2 133  /m²(135 m²)
Sale
Apartments
Apartment
2 rooms
45 m2
Apartments
Apartment
2 rooms
90 m2
2 outbuildings
2025-02-28
116 500 
1 456  /m²(80 m²)
Sale
Houses
House
4 rooms
80 m2
Land
229 m2
-Sols
2025-02-27
219 650 
4 393  /m²(50 m²)
Sale
Apartments
Apartment
2 rooms
50 m2
1 outbuilding
2 outbuildings
2025-02-26
159 435 
1 833  /m²(87 m²)
Sale
Houses
House
4 rooms
87 m2
Land
489 m2
-Sols
2025-02-25
633 000 
2 110  /m²(300 m²)
Sale
Houses
House
7 rooms
300 m2
Land
800 m2
-Sols
Land
4334 m2
-Terrains d'agrément
2025-01-30
15 000 
Sale
Land
3974 m2
-Prés
2025-01-28
20 383 
Sale
Land
3170 m2
-Prés
Land
25294 m2
-Taillis simples
Land
13370 m2
-Prés
Land
4990 m2
-Taillis simples
2025-01-20
280 050 
4 001  /m²(70 m²)
Sale
Apartments
Apartment
3 rooms
70 m2
1 outbuilding
1 outbuilding
2024-12-17
300 000 
1 364  /m²(220 m²)
Sale
Apartments
Apartment
2 rooms
53 m2
Apartments
Apartment
6 rooms
167 m2
6 outbuildings
Land
899 m2
-Terrains d'agrément
Land
500 m2
-Sols
Land
114 m2
-Sols
2024-12-12
1 500 
Sale
Land
4125 m2
-Prés
2024-12-02
200 000 
Sale
Land
2205 m2
-Prés
2024-11-30
422 000 
Sale
Land
336 m2
-Prés
Land
555 m2
-Prés
Land
600 m2
-Prés
Land
672 m2
-Prés
Land
17 m2
-Prés
Land
186 m2
-Prés
Land
50 m2
-Prés
Land
69 m2
-Prés
Land
69 m2
-Prés
Land
9 m2
-Prés
Land
8 m2
-Prés
Land
405 m2
-Prés
Land
404 m2
-Prés
Land
404 m2
-Prés
Land
404 m2
-Prés
Land
413 m2
-Prés
Land
333 m2
-Prés
Land
34 m2
-Prés
2024-10-10
475 500 
5 944  /m²(80 m²)
Sale
Houses
House
4 rooms
80 m2
Land
960 m2
-Sols
2024-10-01
589 000 
4 148  /m²(142 m²)
Sale
Houses
House
5 rooms
142 m2
Land
630 m2
-Sols
Land
362 m2
-Sols
2024-09-20
5 129 
Sale
Land
7414 m2
-Taillis simples
246 transactions listed in the municipality

Savoie (73)

Most expensive cities

City
name
Descending orderHouses
house
Price per m²
41 730 
15 064 
9 926 
8 106 
7 708 
7 667 
7 570 
6 752 
6 184 
City
name
Descending orderApartments
apt.
Price per m²
12 707 
12 414 
10 959 
10 302 
8 611 
6 667 
6 146 
6 116 
5 770 

Least expensive cities

City
name
Ascending orderHouses
house
Price per m²
1 250 
1 316 
1 333 
1 344 
1 354 
1 384 
1 500 
City
name
Ascending orderApartments
apt.
Price per m²
400 
520 
528 
672 
797