emooki
HomePrice mapTransactions
🇬🇧 English🇫🇷 Français🇩🇪 Deutsch🇪🇸 Español🇮🇹 Italiano

Real estate price map


Real estate price map in the municipality of Cognin, choose a section to see transactions by parcel.

Savoie (73)

Cognin - Real estate price m²

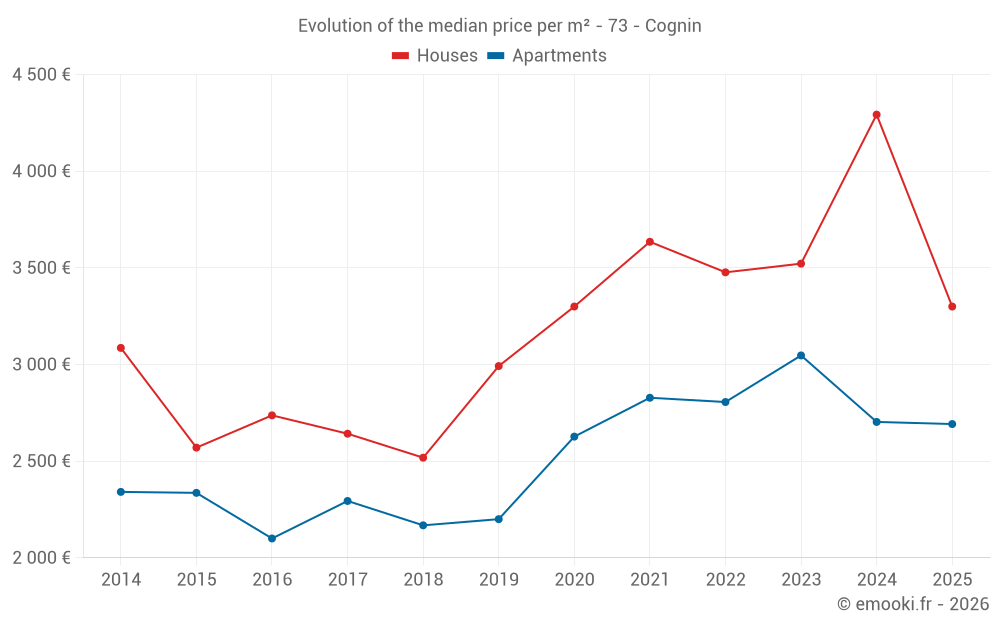
Median price of real estate
in the municipality of Cognin

HousesHouses
3 508  /m²
1-23-45-67-89-10
Reliability 8/10
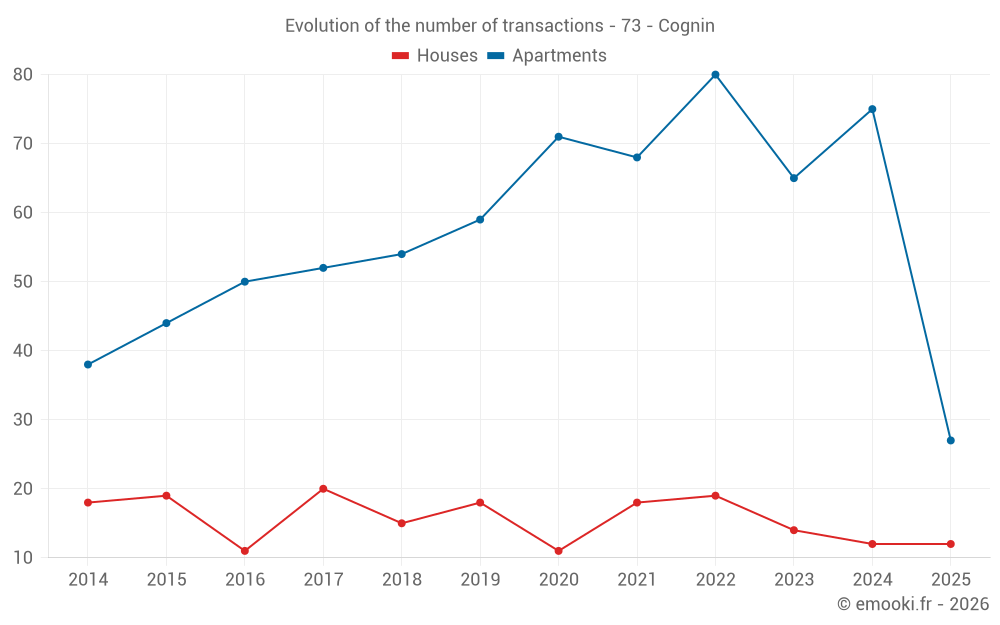
Median price on the 19 transactions of the last 12 months.
from 2 872 to
4 639  /m²
60% of transactions from the 2nd to the 8th deciles.
ApartmentsApartments
2 692  /m²
1-23-45-67-89-10
Reliability 9/10
Median price on the 27 transactions of the last 6 months.
from 1 957 to
3 802  /m²
60% of transactions from the 2nd to the 8th deciles.
DwellingsDwellings
2 763  /m²
1-23-45-67-89-10
Reliability 9/10
Median price on the 39 transactions of the last 6 months.
from 2 005 to
3 834  /m²
60% of transactions from the 2nd to the 8th deciles.
HousesEvolution of the price per m² of houses since...
1 year
-23%
2 years
-6.3%
3 years
-5.1%
4 years
-9.2%
5 years
0%
6 years
+10%
7 years
+31%
8 years
+25%
9 years
+21%
10 years
+28%
11 years
+6.9%
The price per m² of houses has decreased by 23% since 1 year, but it has increased by 31% in 7 years.
ApartmentsEvolution of the price per m² of apartments since...
1 year
-0.4%
2 years
-12%
3 years
-4.1%
4 years
-4.8%
5 years
+2.5%
6 years
+22%
7 years
+24%
8 years
+17%
9 years
+28%
10 years
+15%
11 years
+15%
The price per m² of apartments has decreased by 12% since 2 years, but it has increased by 28% in 9 years.

Yearly evolution

Evolution of the median price per m²

Evolution of the median price per m² - 73 - Cognin

Evolution of the number of transactions

Warning, last year incomplete. Projections made based on the proportions between semesters of the previous year at the departmental/national level and by type of property.

Evolution of the number of transactions - 73 - Cognin

Yearly data

Descending order
Year
Houses
house
transactions
Houses
house
Price per m²
Apartments
apt.
transactions
Apartments
apt.
Price per m²
2025
12
3 300 
27
2 692 
2024
12
4 293 
75
2 703 
2023
14
3 522 
65
3 047 
2022
19
3 477 
80
2 806 
2021
18
3 635 
68
2 828 
2020
11
3 300 
71
2 627 
2019
18
2 992 
59
2 200 
2018
15
2 518 
54
2 168 
2017
20
2 642 
52
2 294 
2016
11
2 737 
50
2 100 
2015
19
2 570 
44
2 336 
2014
18
3 086 
38
2 341 

Analysis

Structure of prices per m²

Values of price percentiles per m² over the periods used for the estimated price of each type of property.

Structure of transaction amounts

Values of transaction amounts percentiles over the periods used for the estimated price of each type of property.

Transaction amounts and prices per m² by percentile

Ascending order
Percentile
Houses
house
Price per m²
Houses
house
Transaction amount
Apartments
apt.
Price per m²
Apartments
apt.
Transaction amount
10th percentile
2 561 
250 K
1 805 
126 K
20th percentile
2 872 
298 K
1 957 
143 K
30th percentile
3 105 
321 K
2 013 
150 K
40th percentile
3 300 
341 K
2 413 
162 K
50th percentile
3 508 
370 K
2 692 
190 K
60th percentile
4 134 
386 K
2 720 
210 K
70th percentile
4 372 
425 K
2 949 
215 K
80th percentile
4 639 
437 K
3 802 
251 K
90th percentile
7 419 
460 K
4 180 
269 K

National and departmental comparison

Evolution of the median price per m² of houses

Evolution of the median price per m² of apartments

Quarterly evolution

Evolution of the median price per m²

Evolution of the number of transactions

Quarterly data

Descending order
Quarter
Houses
house
transactions
Houses
house
Price per m²
Apartments
apt.
transactions
Apartments
apt.
Price per m²
2025 Q2
6
5 479 
13
2 894 
2025 Q1
6
3 138 
14
2 282 
2024 Q4
4
4 293 
19
3 334 
2024 Q3
3
4 390 
26
2 747 
2024 Q2
3
3 938 
14
2 474 
2024 Q1
2
3 696 
16
2 562 
2023 Q4
4
3 934 
11
2 829 
2023 Q3
4
2 986 
16
2 650 
2023 Q2
3
3 044 
16
2 644 
2023 Q1
3
3 851 
22
3 464 
2022 Q4
4
3 180 
30
2 848 
2022 Q3
8
3 417 
13
2 836 
2022 Q2
3
4 069 
19
2 852 
2022 Q1
4
3 718 
18
2 454 
2021 Q4
3
6 023 
19
3 077 
2021 Q3
4
3 104 
18
2 667 
2021 Q2
6
4 078 
18
2 700 
2021 Q1
5
3 395 
13
2 635 
2020 Q4
6
4 010 
31
2 875 
2020 Q3
3
2 782 
14
2 383 
2020 Q2
0
--- 
14
1 912 
2020 Q1
2
3 175 
12
2 078 
2019 Q4
3
4 360 
14
2 822 
2019 Q3
8
2 407 
22
2 328 
2019 Q2
3
3 389 
13
1 847 
2019 Q1
4
1 708 
10
2 051 
2018 Q4
2
3 055 
18
2 512 
2018 Q3
5
2 518 
13
2 100 
2018 Q2
6
2 110 
9
1 959 
2018 Q1
2
2 398 
14
2 129 
2017 Q4
1
943 
10
2 480 
2017 Q3
8
2 746 
16
2 652 
2017 Q2
4
2 570 
17
2 161 
2017 Q1
7
2 765 
9
1 869 
2016 Q4
4
2 838 
17
1 845 
2016 Q3
3
2 782 
14
2 336 
2016 Q2
0
--- 
8
2 038 
2016 Q1
4
2 500 
11
1 983 
2015 Q4
3
2 461 
17
2 530 
2015 Q3
9
2 924 
15
1 975 
2015 Q2
3
2 244 
6
2 448 
2015 Q1
4
2 586 
6
2 617 
2014 Q4
4
2 986 
7
3 092 
2014 Q3
6
3 806 
7
2 222 
2014 Q2
2
2 942 
15
2 401 
2014 Q1
6
2 766 
9
2 300 

Overview of the latest real estate transactions

The following list is an anonymized overview of the latest transactions. For more details and to find all transactions, please use the map to view transactions by plot or the transaction search page for a search by criteria.

2025-06-27
900 000 
6 977  /m²(129 m²)
Sale
Apartments
Apartment
5 rooms
88 m2
Apartments
Apartment
2 rooms
41 m2
2 outbuildings
Land
346 m2
-Sols
2025-06-25
87 550 
4 169  /m²(21 m²)
Sale
Apartments
Apartment
1 room
21 m2
1 outbuilding
2025-06-23
150 000 
Sale
Land
405 m2
-Jardins
/Jardin potager
Land
151 m2
-Sols
2025-06-20
161 650 
2 021  /m²(80 m²)
Sale
1 outbuilding
Apartments
Apartment
4 rooms
80 m2
1 outbuilding
2025-06-12
15 250 
Sale
1 outbuilding
2025-06-12
31 000 
886  /m²(35 m²)
Sale
Commercial property
35 m2
2025-06-10
6 000 
Sale
Land
540 m2
-Taillis simples
Land
351 m2
-Prés
Land
2364 m2
-Prés
Land
68 m2
-Prés
Land
865 m2
-Vignes
2025-06-03
251 730 
4 196  /m²(60 m²)
Sale
Apartments
Apartment
3 rooms
60 m2
1 outbuilding
2025-06-03
332 000 
Sale
Land
145 m2
-Sols
Land
338 m2
-Sols
Land
194 m2
-Sols
2025-05-27
47 700 
Exchange
Land
380 m2
-Prés
2025-05-27
19 200 
Exchange
Land
152 m2
-Sols
2025-05-27
300 000 
2 239  /m²(134 m²)
Sale
Apartments
Apartment
2 rooms
50 m2
Houses
House
4 rooms
84 m2
1 outbuilding
Land
1198 m2
-Sols
Land
380 m2
-Prés
2025-05-23
142 000 
2 679  /m²(53 m²)
Sale
Apartments
Apartment
3 rooms
53 m2
2025-05-14
210 000 
1 981  /m²(106 m²)
Sale
Apartments
Apartment
5 rooms
106 m2
3 outbuildings
2025-05-12
800 000 
10 667  /m²(75 m²)
Sale
Houses
House
5 rooms
75 m2
1 outbuilding
Land
703 m2
-Sols
Land
471 m2
-Jardins
/Jardin potager
2025-05-12
450 000 
7 258  /m²(62 m²)
Sale
Houses
House
3 rooms
62 m2
1 outbuilding
Land
703 m2
-Sols
2025-05-12
500 000 
8 065  /m²(62 m²)
Sale
Houses
House
3 rooms
62 m2
Land
793 m2
-Sols
2025-05-09
190 400 
2 885  /m²(66 m²)
Sale
Apartments
Apartment
3 rooms
66 m2
1 outbuilding
2025-04-30
15 000 
Sale
1 outbuilding
2025-04-29
219 950 
2 894  /m²(76 m²)
Sale
Apartments
Apartment
4 rooms
76 m2
1 outbuilding
1628 transactions listed in the municipality

Savoie (73)

Most expensive cities

City
name
Descending orderHouses
house
Price per m²
41 730 
15 064 
9 926 
8 106 
7 708 
7 667 
7 570 
6 752 
6 184 
City
name
Descending orderApartments
apt.
Price per m²
12 707 
12 414 
10 959 
10 302 
8 611 
6 667 
6 146 
6 116 
5 770 

Least expensive cities

City
name
Ascending orderHouses
house
Price per m²
1 250 
1 316 
1 333 
1 344 
1 354 
1 384 
1 500 
City
name
Ascending orderApartments
apt.
Price per m²
400 
520 
528 
672 
797