emooki
HomePrice mapTransactions
🇬🇧 English🇫🇷 Français🇩🇪 Deutsch🇪🇸 Español🇮🇹 Italiano

Real estate price map


Real estate price map in the municipality of Crêches-sur-Saône, choose a section to see transactions by parcel.

Saône-et-Loire (71)
Crêches-sur-Saône

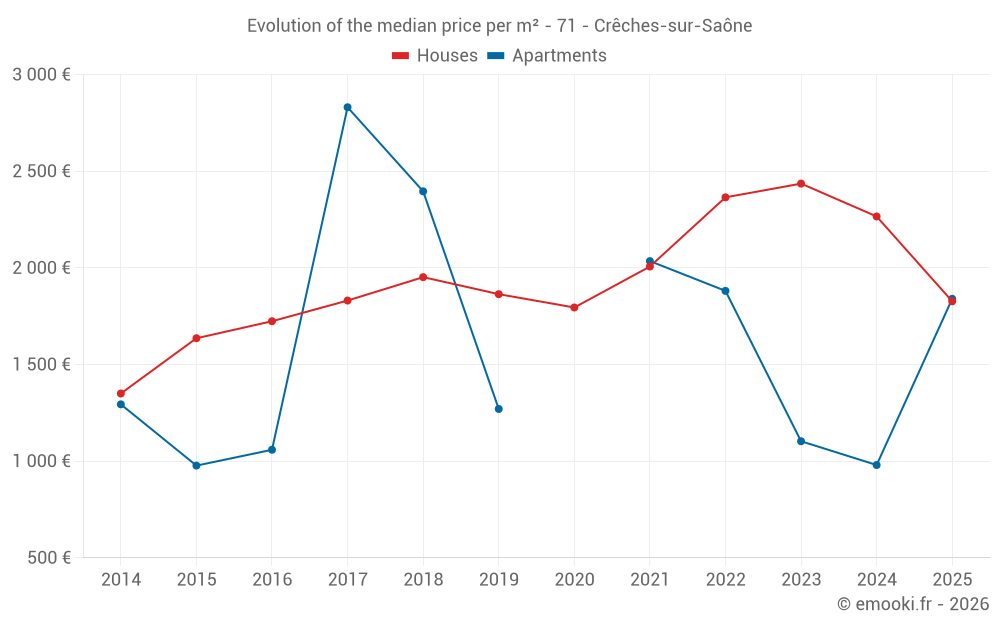
Median price of real estate
in the municipality of Crêches-sur-Saône

HousesHouses
2 195  /m²
1-23-45-67-89-10
Reliability 8/10
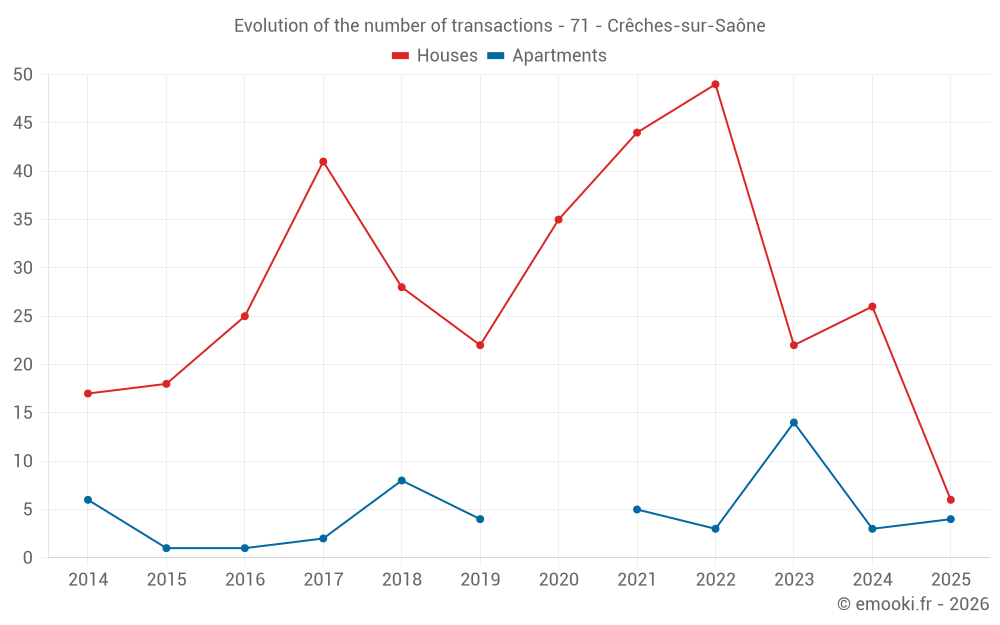
Median price on the 17 transactions of the last 12 months.
from 1 441 to
2 755  /m²
60% of transactions from the 2nd to the 8th deciles.
ApartmentsApartments
1 200  /m²
1-23-45-67-89-10
Reliability 7/10
Median price on the 18 transactions of the last 24 months.
from 1 058 to
1 571  /m²
60% of transactions from the 2nd to the 8th deciles.
DwellingsDwellings
2 153  /m²
1-23-45-67-89-10
Reliability 8/10
Median price on the 22 transactions of the last 12 months.
from 1 379 to
2 755  /m²
60% of transactions from the 2nd to the 8th deciles.
HousesEvolution of the price per m² of houses since...
1 year
-19%
2 years
-25%
3 years
-23%
4 years
-9%
5 years
+1.8%
6 years
-2%
7 years
-6.4%
8 years
-0.2%
9 years
+6%
10 years
+12%
11 years
+35%
The price per m² of houses has decreased by 25% since 2 years, but it has increased by 35% in 11 years.
ApartmentsEvolution of the price per m² of apartments since...
1 year
--
2 years
+67%
3 years
--
4 years
-10%
5 years
--
6 years
+45%
7 years
-23%
8 years
--
9 years
--
10 years
--
11 years
+42%
The price per m² of apartments has increased by 67% since 2 years, but it has decreased by 23% in 7 years.

Yearly evolution

Evolution of the median price per m²

Evolution of the number of transactions

Warning, last year incomplete. Projections made based on the proportions between semesters of the previous year at the departmental/national level and by type of property.

Yearly data

Descending order
Year
Houses
house
transactions
Houses
house
Price per m²
Apartments
apt.
transactions
Apartments
apt.
Price per m²
2025
6
1 827 
4
1 840 
2024
26
2 266 
3
980 
2023
22
2 436 
14
1 103 
2022
49
2 365 
3
1 881 
2021
44
2 007 
5
2 035 
2020
35
1 795 
0
--- 
2019
22
1 864 
4
1 270 
2018
28
1 952 
8
2 396 
2017
41
1 831 
2
2 831 
2016
25
1 724 
1
1 059 
2015
18
1 636 
1
977 
2014
17
1 350 
6
1 294 

Analysis

Structure of prices per m²

Values of price percentiles per m² over the periods used for the estimated price of each type of property.

Structure of transaction amounts

Values of transaction amounts percentiles over the periods used for the estimated price of each type of property.

Transaction amounts and prices per m² by percentile

Ascending order
Percentile
Houses
house
Price per m²
Houses
house
Transaction amount
Apartments
apt.
Price per m²
Apartments
apt.
Transaction amount
10th percentile
1 158 
112 K
1 015 
93 500 
20th percentile
1 441 
122 K
1 058 
100 K
30th percentile
1 908 
150 K
1 077 
103 K
40th percentile
2 036 
171 K
1 092 
109 K
50th percentile
2 195 
180 K
1 200 
120 K
60th percentile
2 466 
227 K
1 317 
136 K
70th percentile
2 542 
276 K
1 370 
149 K
80th percentile
2 755 
284 K
1 571 
166 K
90th percentile
2 889 
322 K
2 106 
192 K

National and departmental comparison

Evolution of the median price per m² of houses

Evolution of the median price per m² of apartments

Quarterly evolution

Evolution of the median price per m²

Evolution of the number of transactions

Quarterly data

Descending order
Quarter
Houses
house
transactions
Houses
house
Price per m²
Apartments
apt.
transactions
Apartments
apt.
Price per m²
2025 Q2
0
--- 
3
1 518 
2025 Q1
6
1 827 
1
3 068 
2024 Q4
7
2 195 
0
--- 
2024 Q3
4
2 910 
1
980 
2024 Q2
8
2 230 
0
--- 
2024 Q1
7
2 198 
2
1 084 
2023 Q4
7
2 234 
4
1 106 
2023 Q3
4
2 430 
7
1 082 
2023 Q2
4
2 910 
2
1 428 
2023 Q1
7
2 416 
1
1 111 
2022 Q4
12
2 516 
0
--- 
2022 Q3
13
2 336 
1
1 881 
2022 Q2
15
2 470 
2
1 522 
2022 Q1
9
2 261 
0
--- 
2021 Q4
13
2 143 
2
1 216 
2021 Q3
12
2 312 
1
2 168 
2021 Q2
8
1 393 
2
2 201 
2021 Q1
11
1 957 
0
--- 
2020 Q4
11
1 862 
0
--- 
2020 Q3
11
1 611 
0
--- 
2020 Q2
6
1 952 
0
--- 
2020 Q1
7
1 858 
0
--- 
2019 Q4
10
1 874 
2
1 390 
2019 Q3
6
1 844 
1
1 213 
2019 Q2
3
1 877 
1
928 
2019 Q1
3
1 818 
0
--- 
2018 Q4
9
1 933 
0
--- 
2018 Q3
10
2 036 
0
--- 
2018 Q2
3
1 815 
2
2 217 
2018 Q1
6
1 914 
6
2 396 
2017 Q4
11
1 847 
2
2 831 
2017 Q3
9
1 568 
0
--- 
2017 Q2
14
1 716 
0
--- 
2017 Q1
7
1 776 
0
--- 
2016 Q4
7
1 742 
0
--- 
2016 Q3
9
1 824 
0
--- 
2016 Q2
4
1 656 
1
1 059 
2016 Q1
5
1 044 
0
--- 
2015 Q4
8
1 516 
0
--- 
2015 Q3
6
1 804 
0
--- 
2015 Q2
3
1 660 
1
977 
2015 Q1
1
838 
0
--- 
2014 Q4
5
1 603 
1
593 
2014 Q3
5
1 217 
2
1 408 
2014 Q2
6
1 200 
2
1 440 
2014 Q1
1
1 936 
1
1 209 

Overview of the latest real estate transactions

The following list is an anonymized overview of the latest transactions. For more details and to find all transactions, please use the map to view transactions by plot or the transaction search page for a search by criteria.

2025-06-18
32 500 
171  /m²(190 m²)
Sale
Commercial property
190 m2
2025-06-05
127 500 
1 518  /m²(84 m²)
Sale
Apartments
Apartment
4 rooms
84 m2
2 outbuildings
2025-05-28
110 000 
1 375  /m²(80 m²)
Sale
Apartments
Apartment
1 room
80 m2
2 outbuildings
2025-05-07
360 000 
1 029  /m²(350 m²)
Sale
Commercial property
350 m2
Land
2462 m2
-Terrains à bâtir
Land
209 m2
-Terrains à bâtir
2025-04-30
212 000 
2 163  /m²(98 m²)
Sale
Apartments
Apartment
4 rooms
98 m2
2 outbuildings
2025-04-24
149 000 
814  /m²(183 m²)
Sale
Commercial property
120 m2
Commercial property
63 m2
1 outbuilding
Land
198 m2
-Sols
2025-03-28
135 000 
3 068  /m²(44 m²)
Sale
Apartments
Apartment
2 rooms
44 m2
1 outbuilding
2025-03-27
70 000 
Sale
Land
222 m2
-Sols
Land
153 m2
-Sols
Land
274 m2
-Terrains à bâtir
Land
557 m2
-Terrains à bâtir
2025-03-26
240 000 
Sale
Land
646 m2
-Terrains à bâtir
2025-03-25
120 000 
1 379  /m²(87 m²)
Sale
Houses
House
4 rooms
87 m2
2025-02-27
100 000 
826  /m²(121 m²)
Sale
Houses
House
5 rooms
121 m2
1 outbuilding
Land
268 m2
-Sols
2025-02-21
110 000 
Sale
Land
100 m2
-Sols
Land
53 m2
-Sols
Land
855 m2
-Jardins
2025-02-04
130 000 
2 708  /m²(48 m²)
Sale
Houses
House
2 rooms
48 m2
2 outbuildings
Land
850 m2
-Sols
2025-01-28
1 000 
Sale
Land
4590 m2
-Prés
2025-01-21
275 000 
1 964  /m²(140 m²)
Sale
Houses
House
4 rooms
140 m2
Land
727 m2
-Sols
2025-01-17
166 000 
2 767  /m²(60 m²)
Sale
Houses
House
1 room
60 m2
Land
398 m2
-Sols
Land
5660 m2
-Terres
2025-01-13
45 000 
Sale
Land
379 m2
-Sols
2025-01-06
2 245 
Sale
Land
3562 m2
-Terres
2025-01-02
282 200 
1 690  /m²(167 m²)
Sale
Houses
House
5 rooms
167 m2
Land
577 m2
-Sols
2024-12-30
45 000 
643  /m²(70 m²)
Sale
Houses
House
3 rooms
70 m2
1 outbuilding
Land
152 m2
-Sols
688 transactions listed in the municipality

Saône-et-Loire (71)

Most expensive cities

City
name
Descending orderHouses
house
Price per m²
2 677 
2 667 
2 604 
2 570 
2 554 
2 508 
City
name
Descending orderApartments
apt.
Price per m²
6 368 
5 118 
3 333 
3 131 
2 806 
2 450 
2 303 

Least expensive cities

City
name
Ascending orderHouses
house
Price per m²
646 
690 
706 
708 
710 
City
name
Ascending orderApartments
apt.
Price per m²
154 
159 
191 
218