emooki
HomePrice mapTransactions
🇬🇧 English🇫🇷 Français🇩🇪 Deutsch🇪🇸 Español🇮🇹 Italiano

Real estate price map


Real estate price map in the municipality of La Chapelle-de-Guinchay, choose a section to see transactions by parcel.

Saône-et-Loire (71)

La Chapelle-de-Guinchay - Real estate price m²

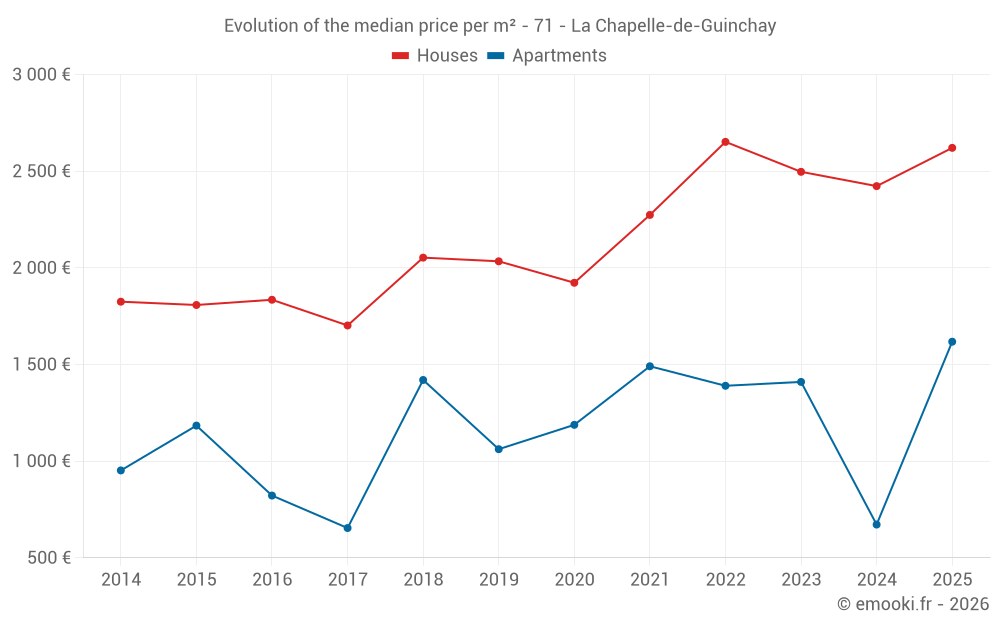
Median price of real estate
in the municipality of La Chapelle-de-Guinchay

HousesHouses
2 622  /m²
1-23-45-67-89-10
Reliability 8/10
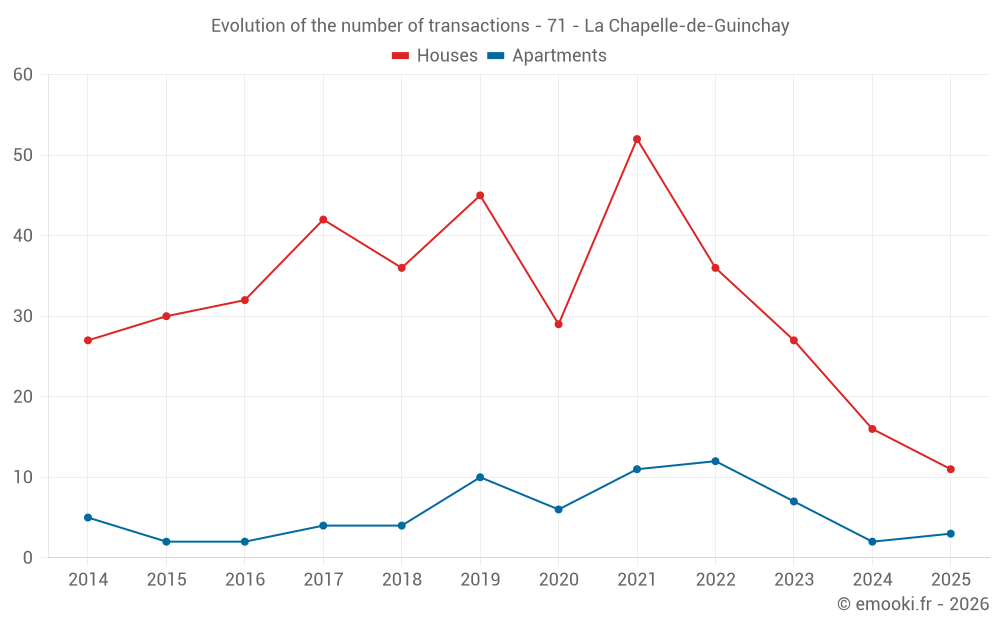
Median price on the 18 transactions of the last 12 months.
from 1 999 to
2 747  /m²
60% of transactions from the 2nd to the 8th deciles.
ApartmentsApartments
1 290  /m²
1-23-45-67-89-10
Reliability 6/10
Median price on the 19 transactions of the last 36 months.
from 918 to
1 776  /m²
60% of transactions from the 2nd to the 8th deciles.
DwellingsDwellings
2 523  /m²
1-23-45-67-89-10
Reliability 8/10
Median price on the 23 transactions of the last 12 months.
from 1 660 to
2 740  /m²
60% of transactions from the 2nd to the 8th deciles.
HousesEvolution of the price per m² of houses since...
1 year
+8.2%
2 years
+5%
3 years
-1.2%
4 years
+15%
5 years
+36%
6 years
+29%
7 years
+28%
8 years
+54%
9 years
+43%
10 years
+45%
11 years
+44%
The price per m² of houses has decreased by 1.2% since 3 years, but it has increased by 54% in 8 years.

Yearly evolution

Evolution of the median price per m²

Evolution of the median price per m² - 71 - La Chapelle-de-Guinchay

Evolution of the number of transactions

Warning, last year incomplete. Projections made based on the proportions between semesters of the previous year at the departmental/national level and by type of property.

Evolution of the number of transactions - 71 - La Chapelle-de-Guinchay

Yearly data

Descending order
Year
Houses
house
transactions
Houses
house
Price per m²
Apartments
apt.
transactions
Apartments
apt.
Price per m²
2025
11
2 621 
3
1 618 
2024
16
2 423 
2
672 
2023
27
2 497 
7
1 410 
2022
36
2 652 
12
1 390 
2021
52
2 274 
11
1 491 
2020
29
1 923 
6
1 188 
2019
45
2 034 
10
1 062 
2018
36
2 053 
4
1 420 
2017
42
1 702 
4
654 
2016
32
1 835 
2
822 
2015
30
1 808 
2
1 184 
2014
27
1 825 
5
952 

Analysis

Structure of prices per m²

Values of price percentiles per m² over the periods used for the estimated price of each type of property.

Structure of transaction amounts

Values of transaction amounts percentiles over the periods used for the estimated price of each type of property.

Transaction amounts and prices per m² by percentile

Ascending order
Percentile
Houses
house
Price per m²
Houses
house
Transaction amount
Apartments
apt.
Price per m²
Apartments
apt.
Transaction amount
10th percentile
1 789 
187 K
726 
56 600 
20th percentile
1 999 
207 K
918 
59 600 
30th percentile
2 351 
215 K
1 048 
66 000 
40th percentile
2 490 
246 K
1 139 
68 400 
50th percentile
2 622 
258 K
1 290 
83 000 
60th percentile
2 639 
270 K
1 406 
88 200 
70th percentile
2 734 
290 K
1 562 
112 K
80th percentile
2 747 
321 K
1 776 
166 K
90th percentile
2 995 
347 K
2 137 
205 K

National and departmental comparison

Evolution of the median price per m² of houses

Evolution of the median price per m² of apartments

Quarterly evolution

Evolution of the median price per m²

Evolution of the number of transactions

Quarterly data

Descending order
Quarter
Houses
house
transactions
Houses
house
Price per m²
Apartments
apt.
transactions
Apartments
apt.
Price per m²
2025 Q2
7
2 621 
2
1 343 
2025 Q1
4
2 551 
1
2 609 
2024 Q4
2
2 222 
1
486 
2024 Q3
5
2 697 
1
857 
2024 Q2
7
2 263 
0
--- 
2024 Q1
2
1 808 
0
--- 
2023 Q4
5
2 760 
2
1 538 
2023 Q3
7
2 769 
1
1 034 
2023 Q2
7
2 362 
2
1 081 
2023 Q1
8
2 176 
2
1 849 
2022 Q4
8
2 232 
4
1 248 
2022 Q3
12
2 970 
3
1 290 
2022 Q2
10
2 770 
2
1 968 
2022 Q1
6
2 358 
3
1 389 
2021 Q4
7
2 469 
0
--- 
2021 Q3
17
2 276 
8
1 642 
2021 Q2
18
2 334 
0
--- 
2021 Q1
10
2 211 
3
1 475 
2020 Q4
7
1 675 
4
1 188 
2020 Q3
10
2 009 
1
1 936 
2020 Q2
4
2 050 
0
--- 
2020 Q1
8
2 000 
1
517 
2019 Q4
9
1 959 
5
902 
2019 Q3
10
1 978 
1
1 084 
2019 Q2
14
2 104 
3
1 915 
2019 Q1
12
1 917 
1
1 291 
2018 Q4
5
2 262 
1
650 
2018 Q3
7
1 924 
2
1 420 
2018 Q2
15
2 020 
1
1 853 
2018 Q1
9
2 061 
0
--- 
2017 Q4
11
1 546 
1
1 287 
2017 Q3
10
1 794 
0
--- 
2017 Q2
16
1 808 
1
873 
2017 Q1
5
1 676 
2
340 
2016 Q4
11
1 704 
0
--- 
2016 Q3
10
1 858 
1
544 
2016 Q2
7
1 958 
0
--- 
2016 Q1
4
1 322 
1
1 099 
2015 Q4
9
1 571 
1
1 052 
2015 Q3
7
1 811 
0
--- 
2015 Q2
9
1 733 
0
--- 
2015 Q1
5
1 838 
1
1 316 
2014 Q4
12
1 884 
2
868 
2014 Q3
7
1 816 
1
1 000 
2014 Q2
3
1 912 
1
1 495 
2014 Q1
5
1 311 
1
840 

Overview of the latest real estate transactions

The following list is an anonymized overview of the latest transactions. For more details and to find all transactions, please use the map to view transactions by plot or the transaction search page for a search by criteria.

2025-06-12
11 072 
Sale
Land
2768 m2
-Prés
2025-05-26
332 150 
3 496  /m²(95 m²)
Sale
Houses
House
5 rooms
95 m2
1 outbuilding
Land
829 m2
-Sols
2025-05-22
55 000 
Sale
Land
542 m2
-Jardins
Land
96 m2
-Jardins
2025-05-16
244 000 
2 624  /m²(93 m²)
Sale
Houses
House
4 rooms
93 m2
1 outbuilding
Land
728 m2
-Sols
2025-05-16
275 000 
1 618  /m²(170 m²)
Sale
Apartments
Apartment
9 rooms
170 m2
2 outbuildings
Land
1371 m2
-Sols
2025-05-15
269 000 
2 053  /m²(131 m²)
Sale
Houses
House
3 rooms
131 m2
Land
190 m2
-Sols
Land
212 m2
-Sols
2025-04-24
246 400 
2 738  /m²(90 m²)
Sale
Houses
House
4 rooms
90 m2
1 outbuilding
Land
610 m2
-Sols
Land
867 m2
-Sols
Land
253 m2
-Sols
Land
542 m2
-Sols
Land
163 m2
-Sols
2025-04-23
100 422 
1 068  /m²(94 m²)
Sale
Apartments
Apartment
3 rooms
94 m2
1 outbuilding
2025-04-22
256 200 
2 350  /m²(109 m²)
Sale
Houses
House
5 rooms
109 m2
Land
522 m2
-Sols
2025-04-15
155 000 
1 722  /m²(90 m²)
Sale
Houses
House
4 rooms
90 m2
Land
480 m2
-Sols
2025-04-07
259 500 
2 621  /m²(99 m²)
Sale
Houses
House
4 rooms
99 m2
Land
1054 m2
-Sols
Land
842 m2
-Sols
Land
14 m2
-Sols
Land
890 m2
-Sols
2025-03-27
15 000 
Sale
Land
1921 m2
-Vignes
/Vins d'appellation d'origine contrôlée
Land
3852 m2
-Vignes
/Vins d'appellation d'origine contrôlée
2025-03-25
65 260 
Sale
Land
1168 m2
-Prés
Land
1850 m2
-Vignes
/Vins d'appellation d'origine contrôlée
Land
2108 m2
-Vignes
/Vins d'appellation d'origine contrôlée
Land
624 m2
-Vignes
/Vins d'appellation d'origine contrôlée
Land
845 m2
-Vignes
/Vins d'appellation d'origine contrôlée
2025-03-22
295 000 
Sale
Land
81 m2
-Jardins
Land
266 m2
-Sols
2025-03-19
1 
Sale
Land
63 m2
-Sols
2025-03-14
210 000 
2 360  /m²(89 m²)
Sale
Houses
House
4 rooms
89 m2
1 outbuilding
Land
512 m2
-Sols
1 outbuilding
Land
584 m2
-Sols
2025-03-11
136 250 
1 514  /m²(90 m²)
Sale
Houses
House
4 rooms
90 m2
1 outbuilding
Land
339 m2
-Sols
1 outbuilding
Land
116 m2
-Sols
2025-02-06
10 000 
Sale
Land
832 m2
-Terres
Land
3650 m2
-Vignes
/Vins d'appellation d'origine contrôlée
Land
2288 m2
-Vignes
/Vins d'appellation d'origine contrôlée
Land
6357 m2
-Vignes
/Vins d'appellation d'origine contrôlée
Land
398 m2
-Vignes
/Vins d'appellation d'origine contrôlée
Land
473 m2
-Vignes
/Vins d'appellation d'origine contrôlée
2025-01-30
340 000 
3 617  /m²(94 m²)
Sale
Houses
House
4 rooms
94 m2
1 outbuilding
Land
838 m2
-Sols
2025-01-29
362 000 
2 742  /m²(132 m²)
Sale
Houses
House
6 rooms
132 m2
Land
571 m2
-Sols
Land
184 m2
-Sols
846 transactions listed in the municipality

Saône-et-Loire (71)

Most expensive cities

City
name
Descending orderHouses
house
Price per m²
2 677 
2 667 
2 604 
2 570 
2 554 
2 508 
City
name
Descending orderApartments
apt.
Price per m²
6 368 
5 118 
3 333 
3 131 
2 806 
2 450 
2 303 

Least expensive cities

City
name
Ascending orderHouses
house
Price per m²
646 
690 
706 
708 
710 
City
name
Ascending orderApartments
apt.
Price per m²
154 
159 
191 
218