emooki
HomePrice mapTransactions
🇬🇧 English🇫🇷 Français🇩🇪 Deutsch🇪🇸 Español🇮🇹 Italiano

Real estate price map


Real estate price map in the municipality of Sancé, choose a section to see transactions by parcel.

Saône-et-Loire (71)
Sancé

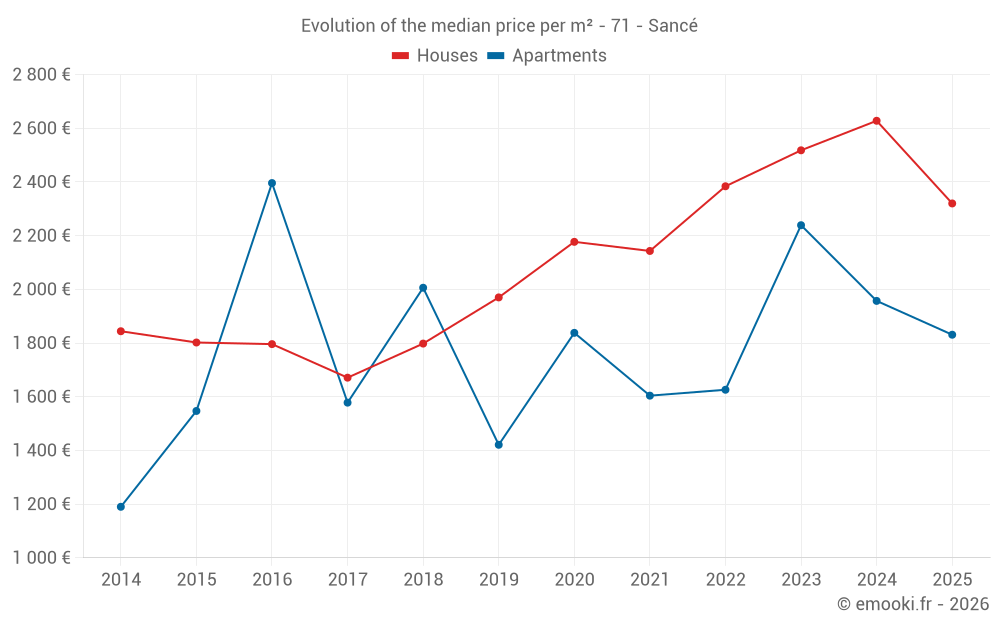
Median price of real estate
in the municipality of Sancé

HousesHouses
2 508  /m²
1-23-45-67-89-10
Reliability 7/10
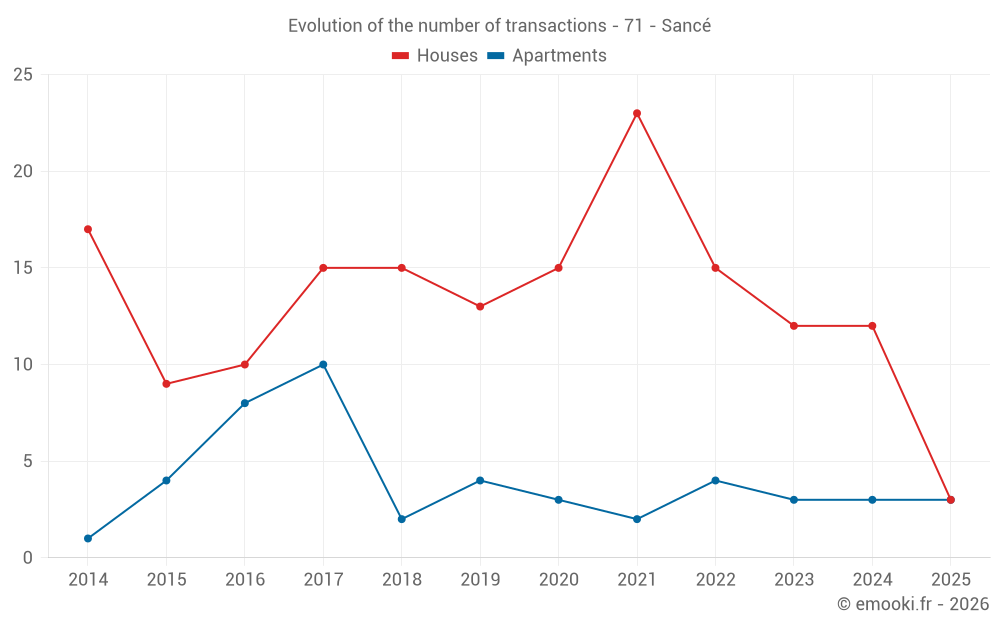
Median price on the 20 transactions of the last 24 months.
from 1 695 to
2 745  /m²
60% of transactions from the 2nd to the 8th deciles.
ApartmentsApartments
1 894  /m²
1-23-45-67-89-10
Reliability 5/10
Median price on the 14 transactions of the last 48 months.
from 1 572 to
2 468  /m²
60% of transactions from the 2nd to the 8th deciles.
DwellingsDwellings
2 320  /m²
1-23-45-67-89-10
Reliability 8/10
Median price on the 17 transactions of the last 12 months.
from 1 594 to
2 873  /m²
60% of transactions from the 2nd to the 8th deciles.

Yearly evolution

Evolution of the median price per m²

Evolution of the number of transactions

Warning, last year incomplete. Projections made based on the proportions between semesters of the previous year at the departmental/national level and by type of property.

Yearly data

Descending order
Year
Houses
house
transactions
Houses
house
Price per m²
Apartments
apt.
transactions
Apartments
apt.
Price per m²
2025
3
2 320 
3
1 831 
2024
12
2 628 
3
1 957 
2023
12
2 518 
3
2 239 
2022
15
2 384 
4
1 626 
2021
23
2 143 
2
1 604 
2020
15
2 177 
3
1 838 
2019
13
1 970 
4
1 421 
2018
15
1 798 
2
2 006 
2017
15
1 671 
10
1 578 
2016
10
1 796 
8
2 396 
2015
9
1 802 
4
1 547 
2014
17
1 844 
1
1 190 

Analysis

Structure of prices per m²

Values of price percentiles per m² over the periods used for the estimated price of each type of property.

Structure of transaction amounts

Values of transaction amounts percentiles over the periods used for the estimated price of each type of property.

Transaction amounts and prices per m² by percentile

Ascending order
Percentile
Houses
house
Price per m²
Houses
house
Transaction amount
Apartments
apt.
Price per m²
Apartments
apt.
Transaction amount
10th percentile
1 416 
144 K
1 483 
82 440 
20th percentile
1 695 
192 K
1 572 
99 920 
30th percentile
1 829 
208 K
1 780 
116 K
40th percentile
2 268 
247 K
1 825 
123 K
50th percentile
2 508 
294 K
1 894 
140 K
60th percentile
2 634 
329 K
2 076 
148 K
70th percentile
2 643 
349 K
2 242 
155 K
80th percentile
2 745 
372 K
2 468 
167 K
90th percentile
2 998 
451 K
2 774 
215 K

National and departmental comparison

Evolution of the median price per m² of houses

Evolution of the median price per m² of apartments

Quarterly evolution

Evolution of the median price per m²

Evolution of the number of transactions

Quarterly data

Descending order
Quarter
Houses
house
transactions
Houses
house
Price per m²
Apartments
apt.
transactions
Apartments
apt.
Price per m²
2025 Q2
1
2 320 
3
1 831 
2025 Q1
2
2 187 
0
--- 
2024 Q4
4
2 254 
1
2 778 
2024 Q3
6
2 182 
0
--- 
2024 Q2
1
2 631 
2
1 890 
2024 Q1
1
2 707 
0
--- 
2023 Q3
5
2 390 
2
2 436 
2023 Q2
3
2 827 
1
2 239 
2023 Q1
4
2 466 
0
--- 
2022 Q4
4
2 142 
0
--- 
2022 Q3
6
3 018 
0
--- 
2022 Q2
2
2 460 
2
1 860 
2022 Q1
3
2 384 
2
1 487 
2021 Q4
6
2 428 
0
--- 
2021 Q3
5
2 087 
1
1 580 
2021 Q2
9
1 792 
1
1 627 
2021 Q1
3
2 319 
0
--- 
2020 Q4
8
2 180 
2
1 871 
2020 Q3
3
2 177 
0
--- 
2020 Q2
3
2 163 
1
1 818 
2020 Q1
1
2 593 
0
--- 
2019 Q4
4
1 880 
1
1 006 
2019 Q3
2
2 231 
1
1 286 
2019 Q2
4
1 686 
1
1 556 
2019 Q1
3
2 118 
1
2 157 
2018 Q4
2
1 836 
0
--- 
2018 Q3
2
1 698 
0
--- 
2018 Q2
7
1 798 
2
2 006 
2018 Q1
4
1 643 
0
--- 
2017 Q4
2
1 810 
2
2 402 
2017 Q3
6
1 685 
3
1 417 
2017 Q2
2
1 041 
3
1 553 
2017 Q1
5
1 680 
2
1 652 
2016 Q4
4
1 956 
1
2 421 
2016 Q3
4
1 815 
6
2 396 
2016 Q1
2
1 702 
1
1 609 
2015 Q4
2
1 708 
1
1 591 
2015 Q3
4
1 782 
0
--- 
2015 Q2
2
2 190 
1
1 490 
2015 Q1
1
1 863 
2
1 547 
2014 Q4
10
1 736 
1
1 190 
2014 Q3
4
2 050 
0
--- 
2014 Q1
3
1 860 
0
--- 

Overview of the latest real estate transactions

The following list is an anonymized overview of the latest transactions. For more details and to find all transactions, please use the map to view transactions by plot or the transaction search page for a search by criteria.

2025-06-23
206 500 
2 320  /m²(89 m²)
Sale
Houses
House
5 rooms
89 m2
Land
398 m2
-Sols
Land
214 m2
-Jardins
/Jardin potager
2025-05-28
119 000 
1 831  /m²(65 m²)
Sale
Apartments
Apartment
3 rooms
65 m2
3 outbuildings
2025-05-21
230 000 
3 651  /m²(63 m²)
Sale
Apartments
Apartment
3 rooms
63 m2
1 outbuilding
2025-05-12
70 000 
Sale
Land
580 m2
-Terrains à bâtir
2025-04-16
99 800 
1 559  /m²(64 m²)
Sale
Apartments
Apartment
2 rooms
64 m2
3 outbuildings
2025-03-31
3 145 000 
964  /m²(3264 m²)
Sale
Commercial property
250 m2
Commercial property
670 m2
Commercial property
1344 m2
Commercial property
420 m2
Commercial property
580 m2
Land
7044 m2
-Sols
2025-03-27
312 500 
1 276  /m²(245 m²)
Sale
Commercial property
245 m2
Land
652 m2
-Sols
2025-03-26
308 670 
2 638  /m²(117 m²)
Sale
Houses
House
5 rooms
117 m2
Land
689 m2
-Sols
Land
910 m2
-Jardins
/Jardin potager
2025-02-04
762 
1  /m²(797 m²)
Sale
Commercial property
797 m2
Land
2511 m2
-Sols
Land
260 m2
-Terrains à bâtir
Land
112 m2
-Terrains d'agrément
2025-01-09
125 000 
1 736  /m²(72 m²)
Sale
Houses
House
3 rooms
72 m2
1 outbuilding
Land
97 m2
-Sols
2024-12-18
350 500 
2 897  /m²(121 m²)
Sale
Houses
House
5 rooms
121 m2
Land
443 m2
-Sols
2024-12-13
100 000 
2 778  /m²(36 m²)
Sale
Apartments
Apartment
1 room
36 m2
4 outbuildings
2024-12-03
239 000 
1 867  /m²(128 m²)
Sale
Houses
House
7 rooms
128 m2
1 outbuilding
Land
639 m2
-Jardins
/Jardin potager
Land
578 m2
-Sols
2024-10-25
162 000 
1 013  /m²(160 m²)
Sale
Houses
House
3 rooms
160 m2
1 outbuilding
Land
820 m2
-Sols
2024-10-15
280 000 
2 642  /m²(106 m²)
Sale
Houses
House
4 rooms
106 m2
Land
588 m2
-Sols
2024-10-11
22 000 
Sale
Land
1878 m2
-Prés
2024-09-27
347 650 
1 531  /m²(227 m²)
Sale
Land
257 m2
-Sols
Houses
House
8 rooms
227 m2
1 outbuilding
Land
421 m2
-Sols
2024-09-25
467 900 
3 835  /m²(122 m²)
Sale
Houses
House
5 rooms
122 m2
2 outbuildings
Land
858 m2
-Sols
2024-09-19
200 000 
1 739  /m²(115 m²)
Sale
Houses
House
6 rooms
115 m2
Land
579 m2
-Sols
2024-09-17
320 200 
2 625  /m²(122 m²)
Sale
Houses
House
4 rooms
122 m2
1 outbuilding
Land
1111 m2
-Sols
382 transactions listed in the municipality

Saône-et-Loire (71)

Most expensive cities

City
name
Descending orderHouses
house
Price per m²
2 677 
2 667 
2 604 
2 570 
2 554 
2 508 
City
name
Descending orderApartments
apt.
Price per m²
6 368 
5 118 
3 333 
3 131 
2 806 
2 450 
2 303 

Least expensive cities

City
name
Ascending orderHouses
house
Price per m²
646 
690 
706 
708 
710 
City
name
Ascending orderApartments
apt.
Price per m²
154 
159 
191 
218