Real estate price map
Real estate price map in the municipality of Épinac, choose a section to see transactions by parcel.
Saône-et-Loire (71)
Price per m² in Épinac
Median price of real estate
in the municipality of Épinac
Houses
887 € /m²
Reliability 9/10
Median price on the 19 transactions of the last 6 months.
from 603 to
1 292 € /m²
1 292 € /m²
60% of transactions from the 2nd to the 8th deciles.
Apartments
954 € /m²
Reliability 5/10
Median price on the 11 transactions of the last 48 months.
from 576 to
1 020 € /m²
1 020 € /m²
60% of transactions from the 2nd to the 8th deciles.
Dwellings
858 € /m²
Reliability 9/10
Median price on the 20 transactions of the last 6 months.
from 614 to
1 249 € /m²
1 249 € /m²
60% of transactions from the 2nd to the 8th deciles.
Evolution of the price per m² of houses since...
1 year
-3.9%
2 years
+4.2%
3 years
+21%
4 years
-25%
5 years
+8.1%
6 years
+4.2%
7 years
-7.8%
8 years
+22%
9 years
-7.1%
10 years
+5.7%
11 years
+2.4%
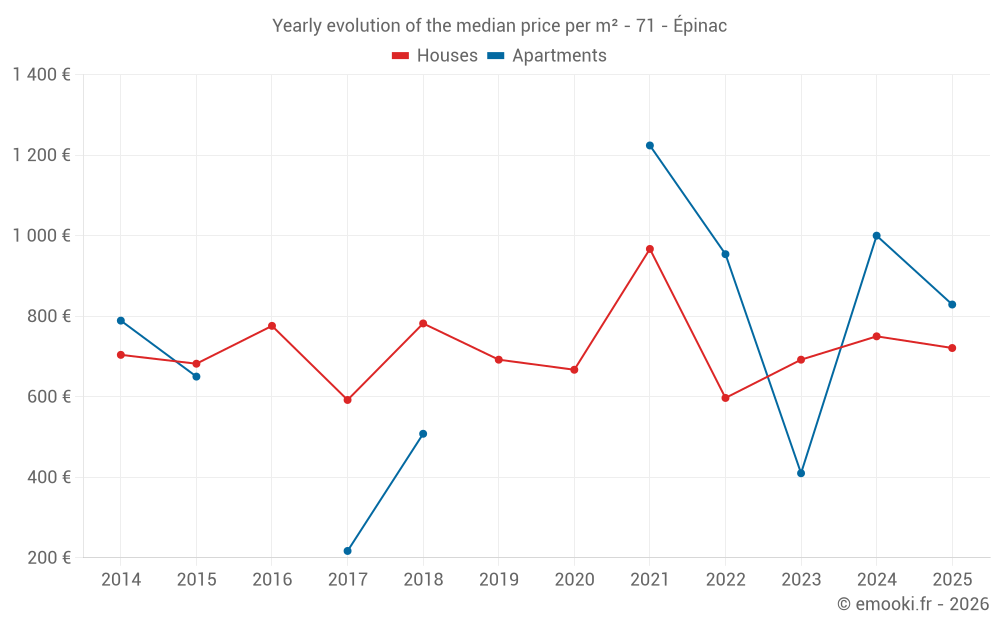
The price per m² of houses has decreased by 25% since 4 years, but it has increased by 22% in 8 years.
549 transactions listed in the municipality
Yearly data
Yearly evolution of the median price per m²
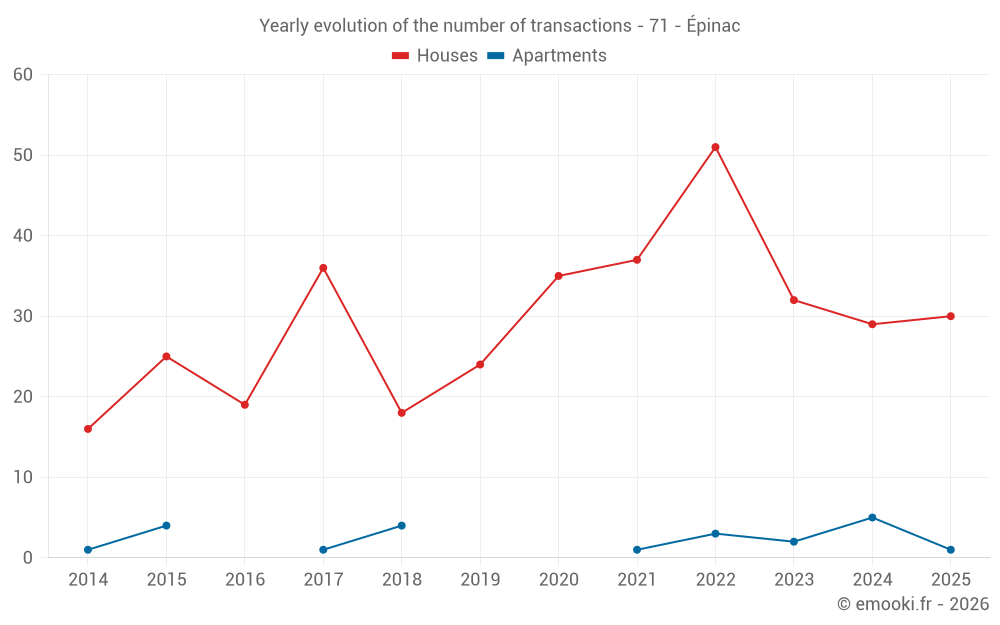
Yearly evolution of the number of transactions
Yearly table
Year
house
transactions
transactions
house
Price per m²
Price per m²
apt.
transactions
transactions
apt.
Price per m²
Price per m²
2025
30
721 €
1
829 €
2024
29
750 €
5
1 000 €
2023
32
692 €
2
410 €
2022
51
597 €
3
954 €
2021
37
967 €
1
1 224 €
2020
35
667 €
0
--- €
2019
24
692 €
0
--- €
2018
18
782 €
4
508 €
2017
36
592 €
1
217 €
2016
19
776 €
0
--- €
2015
25
682 €
4
650 €
2014
16
704 €
1
789 €
Analysis
Structure of prices per m²
Values of price percentiles per m² over the periods used for the estimated price of each type of property.
Structure of transaction amounts
Values of transaction amounts percentiles over the periods used for the estimated price of each type of property.
Transaction amounts and prices per m² by percentile
Percentile
house
Price per m²
Price per m²
house
Transaction amount
Transaction amount
apt.
Price per m²
Price per m²
apt.
Transaction amount
Transaction amount
10th percentile
410 €
34 868 €
511 €
50 000 €
20th percentile
603 €
48 000 €
576 €
62 000 €
30th percentile
653 €
63 878 €
704 €
63 000 €
40th percentile
688 €
70 900 €
829 €
68 000 €
50th percentile
887 €
81 300 €
954 €
75 650 €
60th percentile
956 €
89 600 €
995 €
115 K€
70th percentile
1 092 €
117 K€
1 000 €
168 K€
80th percentile
1 292 €
151 K€
1 020 €
222 K€
90th percentile
1 724 €
178 K€
1 114 €
228 K€
National and departmental comparison
Evolution of the median price per m² of houses
Evolution of the median price per m² of apartments
Quarterly data
Quarterly evolution of the median price per m²
Quarterly evolution of the number of transactions
Quarterly table
Quarter
house
transactions
transactions
house
Price per m²
Price per m²
apt.
transactions
transactions
apt.
Price per m²
Price per m²
2025 Q4
9
692 €
1
829 €
2025 Q3
10
924 €
0
--- €
2025 Q2
7
750 €
0
--- €
2025 Q1
4
516 €
0
--- €
2024 Q4
8
802 €
0
--- €
2024 Q3
7
1 000 €
3
1 000 €
2024 Q2
7
750 €
1
704 €
2024 Q1
7
654 €
1
1 114 €
2023 Q4
9
856 €
0
--- €
2023 Q3
6
503 €
2
410 €
2023 Q2
8
596 €
0
--- €
2023 Q1
9
773 €
0
--- €
2022 Q4
15
562 €
1
1 255 €
2022 Q3
8
596 €
0
--- €
2022 Q2
13
699 €
0
--- €
2022 Q1
15
434 €
2
732 €
2021 Q4
9
1 108 €
1
1 224 €
2021 Q3
12
892 €
0
--- €
2021 Q2
11
1 191 €
0
--- €
2021 Q1
5
472 €
0
--- €
2020 Q4
12
906 €
0
--- €
2020 Q3
7
455 €
0
--- €
2020 Q2
8
559 €
0
--- €
2020 Q1
8
648 €
0
--- €
2019 Q4
5
556 €
0
--- €
2019 Q3
8
754 €
0
--- €
2019 Q2
4
1 461 €
0
--- €
2019 Q1
7
679 €
0
--- €
2018 Q4
6
876 €
1
47 €
2018 Q3
3
1 081 €
1
308 €
2018 Q2
5
694 €
1
763 €
2018 Q1
4
446 €
1
708 €
2017 Q4
8
354 €
0
--- €
2017 Q3
7
562 €
0
--- €
2017 Q2
9
630 €
1
217 €
2017 Q1
12
630 €
0
--- €
2016 Q4
5
1 078 €
0
--- €
2016 Q3
4
480 €
0
--- €
2016 Q2
4
800 €
0
--- €
2016 Q1
6
833 €
0
--- €
2015 Q4
5
1 136 €
1
789 €
2015 Q3
8
470 €
3
510 €
2015 Q2
7
761 €
0
--- €
2015 Q1
5
588 €
0
--- €
2014 Q4
4
280 €
0
--- €
2014 Q3
6
814 €
1
789 €
2014 Q2
5
1 043 €
0
--- €
2014 Q1
1
1 330 €
0
--- €
Key takeaways
What is the price per m2 of houses in Épinac?
The median price on the 19 house transactions of the last 6 months in the municipality of Épinac was 887 € per square meter for a median property value of 81 300 €. Over this period, 60% of transactions were between 603 and 1 292 € per square meter (from the 2nd to the 8th deciles).
Compare with neighboring municipalities
City
name
name
house
Price per m²
Price per m²
apt.
Price per m²
Price per m²
City information
Zip code
- 71360 EPINAC