Real estate price map
Real estate price map in the municipality of Grammont, choose a section to see transactions by parcel.
Haute-Saône (70)
Price per m² in Grammont
Median price of real estate
in the municipality of Grammont
Houses
723 € /m²
Reliability 2/10
Median price on the 4 transactions of the last 96 months.
Apartments
605 € /m²
Reliability 1/10
Median price on the 2 transactions of the last 120 months.
Dwellings
690 € /m²
Reliability 2/10
Median price on the 6 transactions of the last 96 months.
Yearly evolution
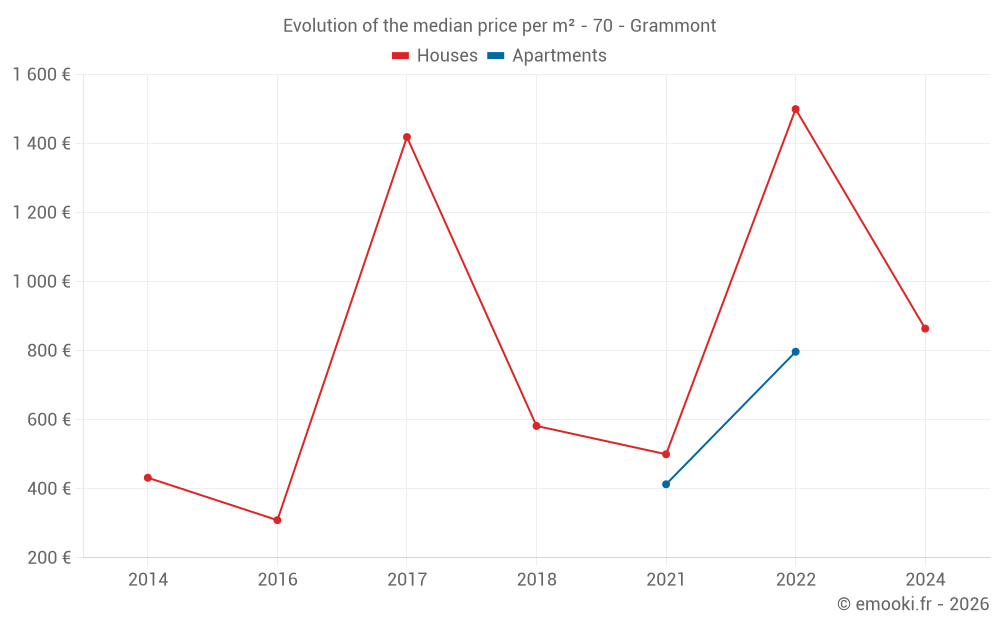
Evolution of the median price per m²
Evolution of the number of transactions
Warning, last year incomplete. Projections made based on the proportions between semesters of the previous year at the departmental/national level and by type of property.
Yearly data
Year
house
transactions
transactions
house
Price per m²
Price per m²
apt.
transactions
transactions
apt.
Price per m²
Price per m²
2025
0
--- €
0
--- €
2024
1
864 €
0
--- €
2023
0
--- €
0
--- €
2022
1
1 500 €
1
797 €
2021
1
500 €
1
413 €
2020
0
--- €
0
--- €
2019
0
--- €
0
--- €
2018
1
582 €
0
--- €
2017
1
1 419 €
0
--- €
2016
1
309 €
0
--- €
2015
0
--- €
0
--- €
2014
1
432 €
0
--- €
Analysis
Structure of prices per m²
Values of price percentiles per m² over the periods used for the estimated price of each type of property.
Structure of transaction amounts
Values of transaction amounts percentiles over the periods used for the estimated price of each type of property.
Transaction amounts and prices per m² by percentile
Percentile
house
Price per m²
Price per m²
house
Transaction amount
Transaction amount
apt.
Price per m²
Price per m²
apt.
Transaction amount
Transaction amount
10th percentile
525 €
52 891 €
451 €
62 300 €
20th percentile
549 €
65 782 €
490 €
67 600 €
30th percentile
574 €
78 673 €
528 €
72 900 €
40th percentile
638 €
83 376 €
567 €
78 200 €
50th percentile
723 €
83 985 €
605 €
83 500 €
60th percentile
808 €
84 594 €
643 €
88 800 €
70th percentile
928 €
87 000 €
682 €
94 100 €
80th percentile
1 118 €
93 000 €
720 €
99 400 €
90th percentile
1 309 €
99 000 €
759 €
105 K€
National and departmental comparison
Evolution of the median price per m² of houses
Evolution of the median price per m² of apartments
Quarterly evolution
Evolution of the median price per m²
Evolution of the number of transactions
Quarterly data
Quarter
house
transactions
transactions
house
Price per m²
Price per m²
apt.
transactions
transactions
apt.
Price per m²
Price per m²
2024 Q4
1
864 €
0
--- €
2022 Q4
0
--- €
1
797 €
2022 Q1
1
1 500 €
0
--- €
2021 Q4
1
500 €
0
--- €
2021 Q3
0
--- €
1
413 €
2018 Q3
1
582 €
0
--- €
2017 Q2
1
1 419 €
0
--- €
2016 Q4
1
309 €
0
--- €
2014 Q1
1
432 €
0
--- €
Overview of the latest real estate transactions
The following list is an anonymized overview of the latest transactions. For more details and to find all transactions, please use the map to view transactions by plot or the transaction search page for a search by criteria.
2025-06-02
5 000 €Sale
Land
1100 m2
-Sols
2025-05-23
545 €Sale
Land
1185 m2
-Prés
2024-12-11
82 970 €864 € /m²(96 m²)
Sale
House
4 rooms
96 m2
Land
462 m2
-Sols
Land
2866 m2
-Vergers
Land
730 m2
-Vergers
Land
835 m2
-Vergers
2024-08-29
1 200 €Sale
Land
2755 m2
-Taillis simples
Land
2755 m2
-Taillis sous futaie
2024-06-14
1 200 €Sale
Land
2600 m2
-Taillis simples
2024-06-10
3 000 €Sale
Land
1580 m2
-Terres
Land
1958 m2
-Vergers
2024-05-27
600 €Sale
Land
1930 m2
-Taillis simples
2023-12-04
8 060 €Sale
Land
2292 m2
-Taillis simples
Land
6878 m2
-Prés
Land
11535 m2
-Prés
2023-05-24
12 074 €Exchange
Land
6090 m2
-Terres
Land
5030 m2
-Terres
Land
29800 m2
-Prés
Land
19450 m2
-Prés
2023-03-20
55 000 €Sale
Land
2035 m2
-Sols
Land
5285 m2
-Prés
Land
1390 m2
-Prés
Land
1330 m2
-Sols
Land
11560 m2
-Prés
2023-03-17
1 500 €Sale
Land
4960 m2
-Vergers
2022-10-06
110 000 €797 € /m²(138 m²)
Sale
Apartment
4 rooms
93 m2
Apartment
2 rooms
45 m2
2 outbuildings
Land
1278 m2
-Sols
Land
1092 m2
-Vergers
Land
1091 m2
-Prés
Land
592 m2
-Jardins
Land
1525 m2
-Vergers
2022-05-16
300 €Sale
Land
476 m2
-Prés
2022-03-21
105 000 €1 500 € /m²(70 m²)
Sale
House
4 rooms
70 m2
Land
480 m2
-Sols
Land
4234 m2
-Vergers
Land
330 m2
-Vergers
2022-03-18
7 140 €Sale
Land
6236 m2
-Vergers
Land
1699 m2
-Prés
Land
1227 m2
-Vergers
Land
2459 m2
-Taillis simples
Land
4077 m2
-Prés
Land
5097 m2
-Prés
Land
1519 m2
-Prés
2022-03-11
20 000 €Sale
Land
9510 m2
-Prés
Land
1788 m2
-Vergers
Land
9132 m2
-Prés
Land
14720 m2
-Prés
Land
39450 m2
-Terres
Land
13150 m2
-Terres
2021-11-05
40 000 €500 € /m²(80 m²)
Sale
House
3 rooms
80 m2
Land
639 m2
-Sols
Land
1060 m2
-Prés
Land
141 m2
-Jardins
2021-07-22
57 000 €413 € /m²(138 m²)
Sale
Apartment
4 rooms
93 m2
Apartment
2 rooms
45 m2
2 outbuildings
Land
1278 m2
-Sols
Land
1091 m2
-Prés
Land
1092 m2
-Vergers
Land
592 m2
-Jardins
Land
1525 m2
-Vergers
2021-07-16
4 000 €Sale
Land
930 m2
-Vergers
Land
1190 m2
-Vergers
2021-05-28
3 000 €Sale
Land
283 m2
-Sols
Land
180 m2
-Sols
Land
108 m2
-Sols
41 transactions listed in the municipality
Compare with neighboring municipalities
City
name
name
house
Price per m²
Price per m²
apt.
Price per m²
Price per m²
City information
Zip code
- 70110 GRAMMONT
Data source & update
- Latest publication of the property value request (DVF) database made available by the DGFiP on October 19, 2025, covering transactions up to 06/30/2025:
- Administrative/cadastral division as of September 1, 2025, and municipal movements as of January 1, 2025: