Real estate price map
Real estate price map in the municipality of Belles-Fontaines, choose a section to see transactions by parcel.
Haute-Saône (70)
Price per m² in Belles-Fontaines
Median price of real estate
in the municipality of Belles-Fontaines
Houses
912 € /m²
Reliability 6/10
Median price on the 14 transactions of the last 36 months.
from 515 to
1 896 € /m²
1 896 € /m²
60% of transactions from the 2nd to the 8th deciles.
Yearly evolution
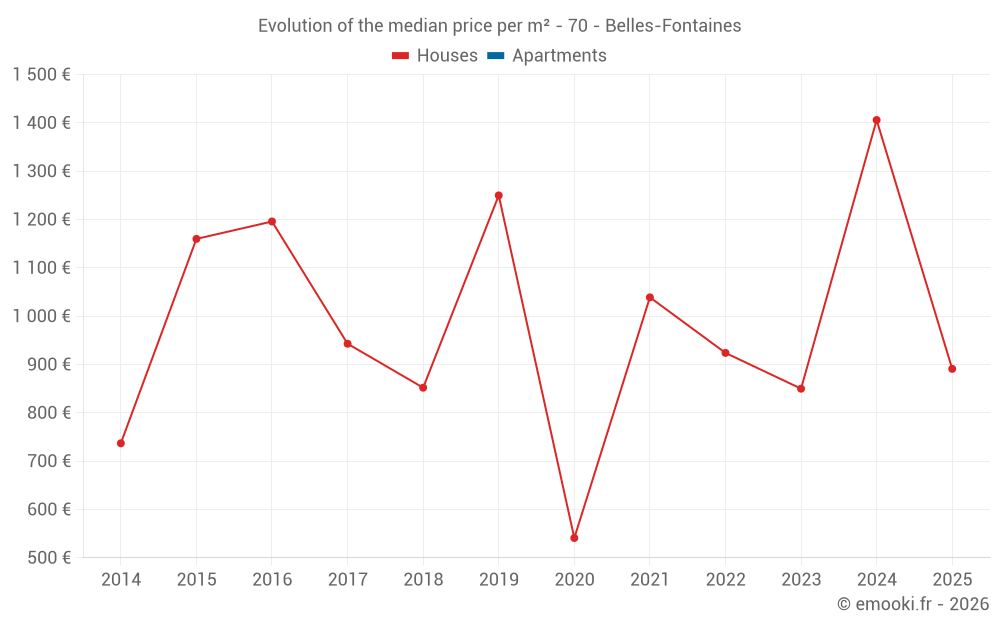
Evolution of the median price per m²
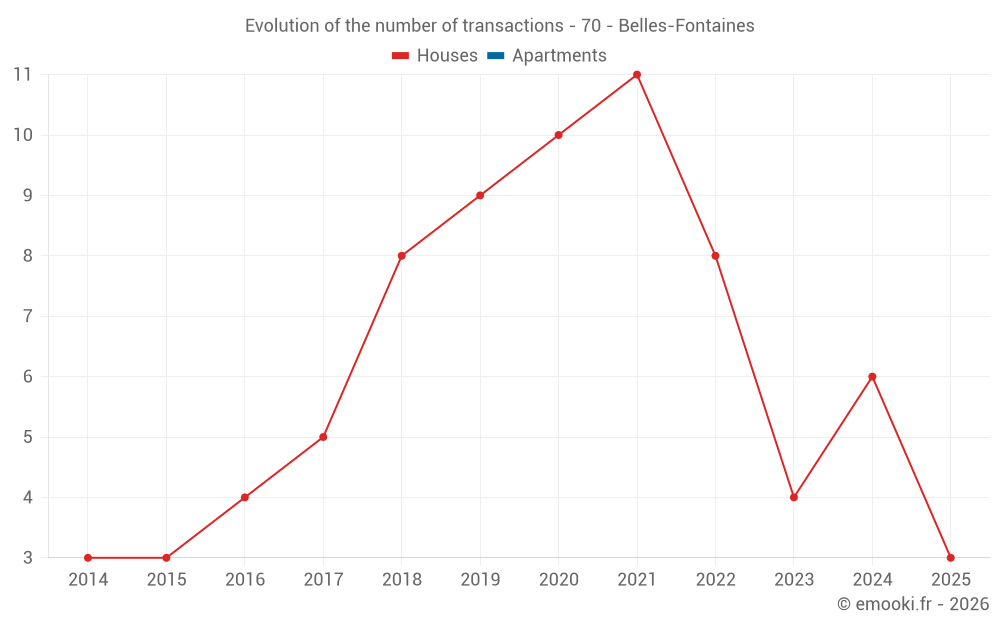
Evolution of the number of transactions
Warning, last year incomplete. Projections made based on the proportions between semesters of the previous year at the departmental/national level and by type of property.
Yearly data
Year
house
transactions
transactions
house
Price per m²
Price per m²
apt.
transactions
transactions
apt.
Price per m²
Price per m²
2025
3
891 €
0
--- €
2024
6
1 406 €
0
--- €
2023
4
850 €
0
--- €
2022
8
924 €
0
--- €
2021
11
1 039 €
0
--- €
2020
10
541 €
0
--- €
2019
9
1 250 €
0
--- €
2018
8
852 €
0
--- €
2017
5
943 €
0
--- €
2016
4
1 196 €
0
--- €
2015
3
1 160 €
0
--- €
2014
3
737 €
0
--- €
Analysis
Structure of prices per m²
Values of price percentiles per m² over the periods used for the estimated price of each type of property.
Structure of transaction amounts
Values of transaction amounts percentiles over the periods used for the estimated price of each type of property.
Transaction amounts and prices per m² by percentile
Percentile
house
Price per m²
Price per m²
house
Transaction amount
Transaction amount
apt.
Price per m²
Price per m²
apt.
Transaction amount
Transaction amount
10th percentile
264 €
40 550 €
--- €
--- €
20th percentile
515 €
69 400 €
--- €
--- €
30th percentile
851 €
84 500 €
--- €
--- €
40th percentile
884 €
93 000 €
--- €
--- €
50th percentile
912 €
114 K€
--- €
--- €
60th percentile
959 €
129 K€
--- €
--- €
70th percentile
1 366 €
146 K€
--- €
--- €
80th percentile
1 896 €
167 K€
--- €
--- €
90th percentile
2 054 €
187 K€
--- €
--- €
National and departmental comparison
Evolution of the median price per m² of houses
Evolution of the median price per m² of apartments
Quarterly evolution
Evolution of the median price per m²
Evolution of the number of transactions
Quarterly data
Quarter
house
transactions
transactions
house
Price per m²
Price per m²
apt.
transactions
transactions
apt.
Price per m²
Price per m²
2025 Q2
2
886 €
0
--- €
2025 Q1
1
933 €
0
--- €
2024 Q4
1
879 €
0
--- €
2024 Q3
4
1 406 €
0
--- €
2024 Q1
1
2 124 €
0
--- €
2023 Q4
3
388 €
0
--- €
2023 Q3
1
2 090 €
0
--- €
2022 Q3
1
211 €
0
--- €
2022 Q2
3
1 154 €
0
--- €
2022 Q1
4
980 €
0
--- €
2021 Q4
3
1 039 €
0
--- €
2021 Q3
2
1 267 €
0
--- €
2021 Q2
3
853 €
0
--- €
2021 Q1
3
1 208 €
0
--- €
2020 Q4
2
894 €
0
--- €
2020 Q3
2
466 €
0
--- €
2020 Q2
2
512 €
0
--- €
2020 Q1
4
541 €
0
--- €
2019 Q4
5
1 273 €
0
--- €
2019 Q3
3
1 089 €
0
--- €
2019 Q1
1
1 358 €
0
--- €
2018 Q4
5
917 €
0
--- €
2018 Q3
3
787 €
0
--- €
2017 Q4
1
943 €
0
--- €
2017 Q3
3
1 448 €
0
--- €
2017 Q2
1
522 €
0
--- €
2016 Q4
1
1 184 €
0
--- €
2016 Q3
2
1 255 €
0
--- €
2016 Q1
1
547 €
0
--- €
2015 Q3
2
1 030 €
0
--- €
2015 Q1
1
1 587 €
0
--- €
2014 Q4
1
716 €
0
--- €
2014 Q2
1
909 €
0
--- €
2014 Q1
1
737 €
0
--- €
Overview of the latest real estate transactions
The following list is an anonymized overview of the latest transactions. For more details and to find all transactions, please use the map to view transactions by plot or the transaction search page for a search by criteria.
2025-06-25
2 500 €Sale
Land
2405 m2
-Taillis simples
Land
2350 m2
-Taillis simples
Land
815 m2
-Taillis simples
2025-06-23
200 €Sale
Land
370 m2
-Taillis simples
2025-06-23
1 300 €Sale
Land
343 m2
-Vergers
Land
325 m2
-Vergers
Land
350 m2
-Vergers
Land
300 m2
-Vergers
Land
876 m2
-Vergers
Land
850 m2
-Prés
Land
1590 m2
-Taillis simples
Land
360 m2
-Vergers
2025-06-12
1 652 €Sale
Land
11800 m2
-Futaies résineuses
2025-05-20
400 €Sale
Land
290 m2
-Vergers
Land
450 m2
-Prés
2025-05-14
200 €Sale
Land
390 m2
-Vergers
Land
495 m2
-Vergers
Land
370 m2
-Vergers
2025-05-14
1 000 €Sale
Land
1640 m2
-Taillis simples
Land
1720 m2
-Taillis simples
2025-05-14
1 €Sale
Land
1340 m2
-Vergers
2025-05-09
192 200 €882 € /m²(218 m²)
Sale
3 outbuildings
Land
1640 m2
-Prés
House
4 rooms
218 m2
Land
559 m2
-Sols
Land
216 m2
-Prés
Land
619 m2
-Vergers
Land
9 m2
-Sols
Land
10 m2
-Sols
2025-04-30
600 €Sale
Land
1200 m2
-Taillis simples
Land
850 m2
-Taillis simples
2025-04-28
122 000 €891 € /m²(137 m²)
Sale
House
6 rooms
137 m2
Land
905 m2
-Sols
2025-04-18
1 300 €Sale
Land
1033 m2
-Taillis simples
Land
2082 m2
-Taillis simples
Land
1030 m2
-Landes
2025-04-18
3 000 €Sale
Land
1985 m2
-Taillis simples
Land
2983 m2
-Prés
Land
3132 m2
-Terres
2025-03-11
600 €Sale
Land
1460 m2
-Vergers
2025-02-08
130 550 €933 € /m²(140 m²)
Sale
House
5 rooms
140 m2
Land
310 m2
-Sols
Land
251 m2
-Vergers
Land
400 m2
-Jardins
Land
86 m2
-Sols
2025-01-27
140 €Sale
Land
228 m2
-Vergers
Land
655 m2
-Vergers
2025-01-27
2 000 €Sale
Land
1360 m2
-Taillis simples
Land
5300 m2
-Taillis simples
Land
950 m2
-Taillis simples
Land
905 m2
-Taillis simples
Land
660 m2
-Taillis simples
Land
840 m2
-Taillis simples
Land
1000 m2
-Taillis simples
Land
1230 m2
-Taillis simples
Land
1260 m2
-Taillis simples
Land
220 m2
-Taillis simples
2025-01-27
140 €Sale
Land
640 m2
-Vergers
2024-12-16
80 000 €879 € /m²(91 m²)
Sale
House
5 rooms
91 m2
Land
969 m2
-Sols
2024-12-09
200 €Sale
Land
2524 m2
-Taillis simples
283 transactions listed in the municipality
Compare with neighboring municipalities
City
name
name
house
Price per m²
Price per m²
apt.
Price per m²
Price per m²
City information
Zip code
- 70110 COURCHATON
Data source & update
- Latest publication of the property value request (DVF) database made available by the DGFiP on October 19, 2025, covering transactions up to 06/30/2025:
- Administrative/cadastral division as of September 1, 2025, and municipal movements as of January 1, 2025: