emooki
HomePrice mapTransactions
🇬🇧 English🇫🇷 Français🇩🇪 Deutsch🇪🇸 Español🇮🇹 Italiano

Real estate price map


Real estate price map in the municipality of Châlonvillars, choose a section to see transactions by parcel.

Haute-Saône (70)
Châlonvillars

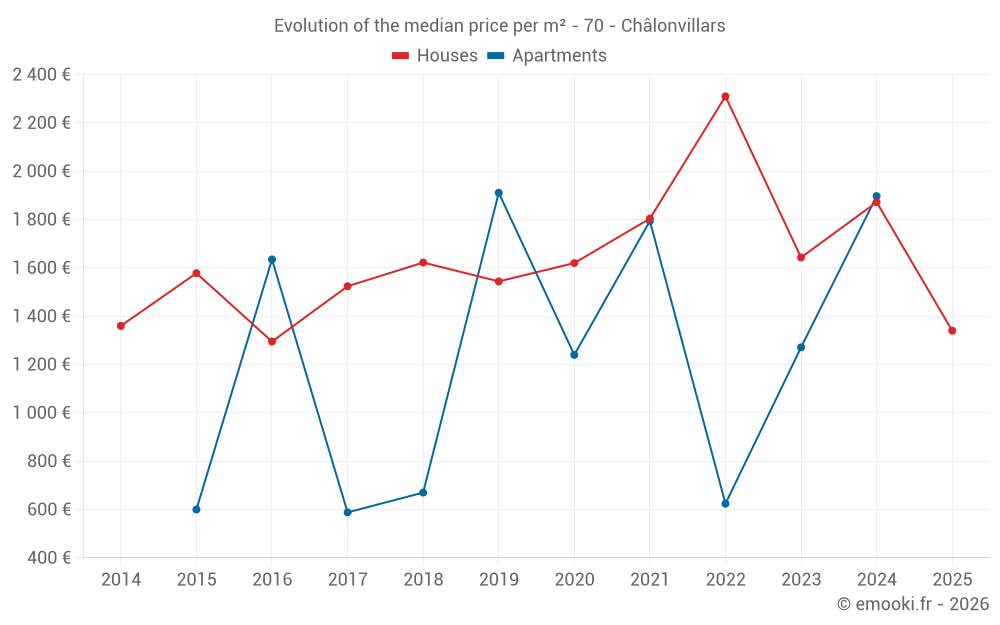
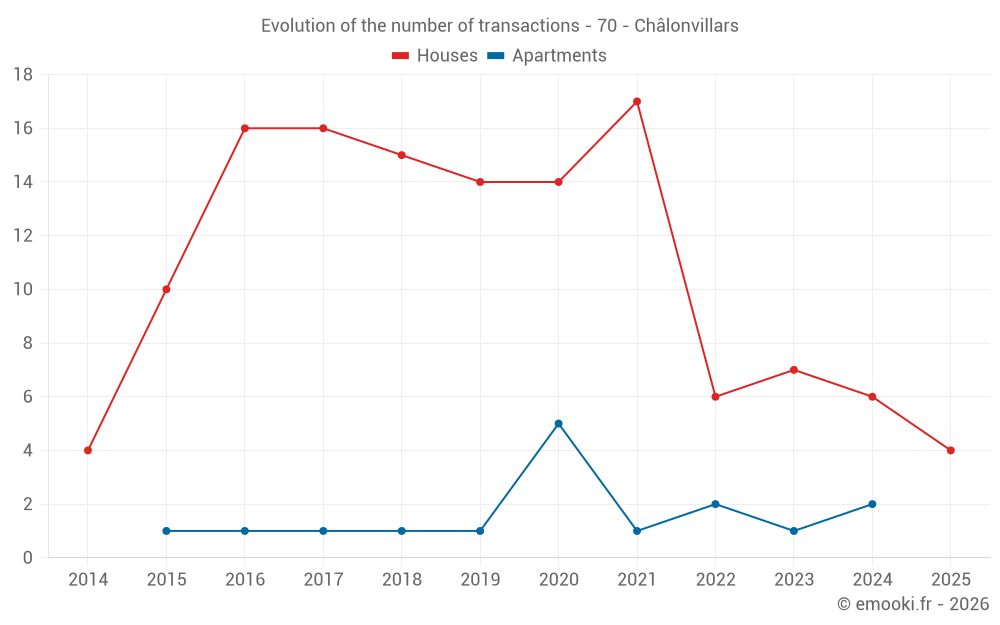
Median price of real estate
in the municipality of Châlonvillars

HousesHouses
1 780  /m²
1-23-45-67-89-10
Reliability 7/10
Median price on the 14 transactions of the last 24 months.
from 1 171 to
2 357  /m²
60% of transactions from the 2nd to the 8th deciles.
ApartmentsApartments
1 794  /m²
1-23-45-67-89-10
Reliability 4/10
Median price on the 9 transactions of the last 60 months.
DwellingsDwellings
1 810  /m²
1-23-45-67-89-10
Reliability 7/10
Median price on the 17 transactions of the last 24 months.
from 1 291 to
2 261  /m²
60% of transactions from the 2nd to the 8th deciles.
HousesEvolution of the price per m² of houses since...
1 year
-28%
2 years
-18%
3 years
-42%
4 years
-26%
5 years
-17%
6 years
-13%
7 years
-17%
8 years
-12%
9 years
+3.5%
10 years
-15%
11 years
-1.5%
The price per m² of houses has decreased by 42% since 3 years, but it has increased by 3.5% in 9 years.

Yearly evolution

Evolution of the median price per m²

Evolution of the number of transactions

Warning, last year incomplete. Projections made based on the proportions between semesters of the previous year at the departmental/national level and by type of property.

Yearly data

Descending order
Year
Houses
house
transactions
Houses
house
Price per m²
Apartments
apt.
transactions
Apartments
apt.
Price per m²
2025
4
1 340 
0
--- 
2024
6
1 872 
2
1 897 
2023
7
1 643 
1
1 271 
2022
6
2 310 
2
624 
2021
17
1 804 
1
1 794 
2020
14
1 620 
5
1 240 
2019
14
1 544 
1
1 911 
2018
15
1 622 
1
670 
2017
16
1 524 
1
588 
2016
16
1 295 
1
1 635 
2015
10
1 578 
1
600 
2014
4
1 360 
0
--- 

Analysis

Structure of prices per m²

Values of price percentiles per m² over the periods used for the estimated price of each type of property.

Structure of transaction amounts

Values of transaction amounts percentiles over the periods used for the estimated price of each type of property.

Transaction amounts and prices per m² by percentile

Ascending order
Percentile
Houses
house
Price per m²
Houses
house
Transaction amount
Apartments
apt.
Price per m²
Apartments
apt.
Transaction amount
10th percentile
561 
111 K
708 
64 000 
20th percentile
1 171 
139 K
866 
103 K
30th percentile
1 551 
163 K
1 068 
132 K
40th percentile
1 664 
167 K
1 376 
141 K
50th percentile
1 780 
173 K
1 794 
144 K
60th percentile
1 844 
189 K
1 799 
149 K
70th percentile
1 937 
207 K
1 824 
157 K
80th percentile
2 357 
223 K
1 844 
169 K
90th percentile
2 784 
285 K
1 869 
182 K

National and departmental comparison

Evolution of the median price per m² of houses

Evolution of the median price per m² of apartments

Quarterly evolution

Evolution of the median price per m²

Evolution of the number of transactions

Quarterly data

Descending order
Quarter
Houses
house
transactions
Houses
house
Price per m²
Apartments
apt.
transactions
Apartments
apt.
Price per m²
2025 Q2
2
1 384 
0
--- 
2025 Q1
2
1 340 
0
--- 
2024 Q4
2
2 492 
0
--- 
2024 Q3
1
2 956 
0
--- 
2024 Q2
3
1 750 
0
--- 
2024 Q1
0
--- 
2
1 897 
2023 Q4
3
1 643 
1
1 271 
2023 Q3
1
1 372 
0
--- 
2023 Q1
3
2 031 
0
--- 
2022 Q3
4
2 462 
2
624 
2022 Q2
1
2 293 
0
--- 
2022 Q1
1
2 328 
0
--- 
2021 Q4
6
1 825 
0
--- 
2021 Q3
5
2 161 
1
1 794 
2021 Q2
5
1 677 
0
--- 
2021 Q1
1
1 327 
0
--- 
2020 Q4
4
1 185 
2
1 820 
2020 Q3
3
1 846 
1
933 
2020 Q2
3
1 890 
1
1 240 
2020 Q1
4
1 982 
1
1 116 
2019 Q4
5
1 586 
1
1 911 
2019 Q3
2
1 746 
0
--- 
2019 Q2
5
1 501 
0
--- 
2019 Q1
2
1 562 
0
--- 
2018 Q4
7
1 344 
0
--- 
2018 Q3
2
1 538 
0
--- 
2018 Q2
3
1 696 
0
--- 
2018 Q1
3
2 132 
1
670 
2017 Q4
2
1 280 
0
--- 
2017 Q3
8
1 524 
0
--- 
2017 Q2
5
1 671 
1
588 
2017 Q1
1
602 
0
--- 
2016 Q4
5
1 401 
0
--- 
2016 Q3
4
1 134 
0
--- 
2016 Q2
4
997 
1
1 635 
2016 Q1
3
1 060 
0
--- 
2015 Q4
3
818 
0
--- 
2015 Q3
1
1 570 
0
--- 
2015 Q2
3
1 938 
1
600 
2015 Q1
3
2 014 
0
--- 
2014 Q4
1
1 000 
0
--- 
2014 Q3
1
1 874 
0
--- 
2014 Q1
2
1 200 
0
--- 

Overview of the latest real estate transactions

The following list is an anonymized overview of the latest transactions. For more details and to find all transactions, please use the map to view transactions by plot or the transaction search page for a search by criteria.

2025-05-30
206 000 
2 341  /m²(88 m²)
Sale
Houses
House
5 rooms
88 m2
1 outbuilding
Land
473 m2
-Sols
Land
562 m2
-Terrains d'agrément
Land
6 m2
-Sols
2025-05-21
1 000 
Sale
Land
572 m2
-Jardins
Land
600 m2
-Vergers
2025-04-25
170 000 
428  /m²(397 m²)
Sale
Apartments
Apartment
4 rooms
118 m2
Apartments
Apartment
4 rooms
95 m2
Apartments
Apartment
4 rooms
110 m2
Houses
House
3 rooms
74 m2
4 outbuildings
Land
818 m2
-Sols
1 outbuilding
Land
43 m2
-Sols
Land
203 m2
-Jardins
2025-03-07
202 000 
Sale
Land
709 m2
-Terres
2025-02-28
191 900 
1 810  /m²(106 m²)
Sale
1 outbuilding
Houses
House
5 rooms
106 m2
Land
314 m2
-Vergers
2025-02-10
7 000 
Sale
Land
1610 m2
-Terres
Land
1239 m2
-Terres
Land
4082 m2
-Terres
Land
378 m2
-Taillis simples
Land
2590 m2
-Taillis simples
Land
1880 m2
-Taillis simples
Land
5615 m2
-Landes
/Friche
Land
4170 m2
-Landes
/Friche
Land
51 m2
-Terres
Land
244 m2
-Taillis simples
Land
12349 m2
-Terres
2025-01-29
100 000 
870  /m²(115 m²)
Sale
Houses
House
5 rooms
115 m2
Land
1405 m2
-Jardins
Land
1000 m2
-Sols
Land
1034 m2
-Prés
Land
834 m2
-Prés
2025-01-16
1 850 
Sale
Land
512 m2
-Prés
Land
797 m2
-Prés
Land
3130 m2
-Terres
Land
4135 m2
-Prés
2025-01-15
1 945 
Sale
Land
1851 m2
-Taillis sous futaie
Land
1420 m2
-Futaies résineuses
Land
2670 m2
-Taillis simples
Land
5650 m2
-Prés
Land
1418 m2
-Futaies résineuses
2024-12-18
461 
Sale
Land
1845 m2
-Terres
2024-12-18
9 965 
Sale
Land
4745 m2
-Eaux
2024-12-05
166 800 
1 853  /m²(90 m²)
Sale
Houses
House
4 rooms
90 m2
2 outbuildings
Land
831 m2
-Sols
Land
869 m2
-Jardins
2024-11-29
67 000 
Sale
Land
995 m2
-Prés
2024-11-05
1 000 
Sale
Land
2910 m2
-Taillis simples
2024-10-30
3 250 
Sale
Land
2981 m2
-Prés
Land
1230 m2
-Prés
Land
5450 m2
-Prés
Land
2090 m2
-Prés
2024-10-17
228 500 
3 130  /m²(73 m²)
Sale
Houses
House
3 rooms
73 m2
Land
127 m2
-Vergers
Land
153 m2
-Sols
2024-10-11
4 000 
Sale
Land
470 m2
-Terres
2024-10-02
36 000 
Sale
Land
1 m2
-Sols
Land
311 m2
-Jardins
Land
740 m2
-Vergers
2024-08-26
12 000 
Sale
Land
650 m2
-Prés
Land
730 m2
-Prés
Land
137 m2
-Prés
Land
883 m2
-Eaux
Land
740 m2
-Prés
Land
2375 m2
-Prés
Land
1427 m2
-Terres
2024-07-31
393 200 
2 956  /m²(133 m²)
Sale
Houses
House
6 rooms
133 m2
1 outbuilding
Land
500 m2
-Sols
Land
1534 m2
-Jardins
Land
35 m2
-Sols
277 transactions listed in the municipality

Haute-Saône (70)

Most expensive cities

City
name
Descending orderHouses
house
Price per m²
6 792 
2 372 
2 266 
2 217 
2 209 
2 162 
City
name
Descending orderApartments
apt.
Price per m²
53 722 
2 439 
1 940 
1 794 
1 610 
1 486 
1 478 

Least expensive cities

City
name
Ascending orderHouses
house
Price per m²
252 
310 
310 
311 
313 
329 
333 
City
name
Ascending orderApartments
apt.
Price per m²
57 
76 
84 
102 
108 
118