Real estate price map
Real estate price map in the municipality of Hurecourt, choose a section to see transactions by parcel.
Haute-Saône (70)
Price per m² in Hurecourt
Median price of real estate
in the municipality of Hurecourt
Houses
310 € /m²
Reliability 2/10
Median price on the 4 transactions of the last 96 months.
Yearly evolution
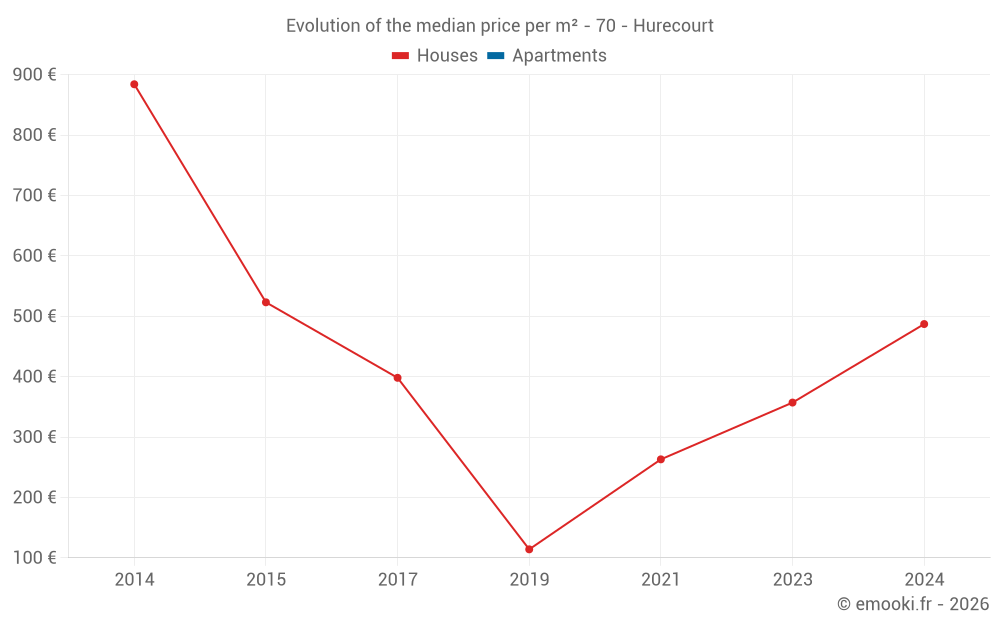
Evolution of the median price per m²
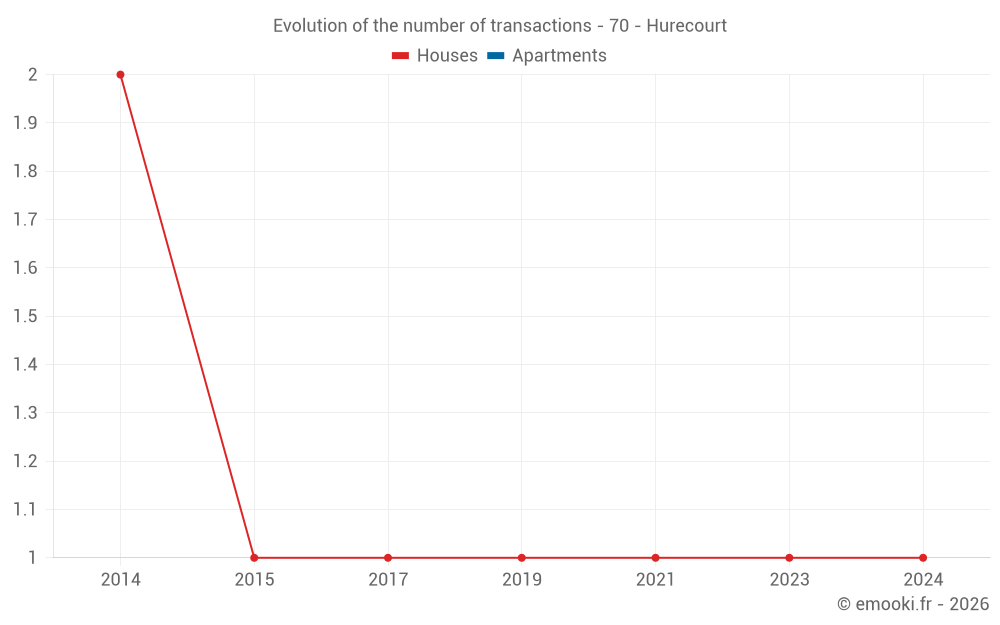
Evolution of the number of transactions
Warning, last year incomplete. Projections made based on the proportions between semesters of the previous year at the departmental/national level and by type of property.
Yearly data
Year
house
transactions
transactions
house
Price per m²
Price per m²
apt.
transactions
transactions
apt.
Price per m²
Price per m²
2025
0
--- €
0
--- €
2024
1
487 €
0
--- €
2023
1
357 €
0
--- €
2022
0
--- €
0
--- €
2021
1
263 €
0
--- €
2020
0
--- €
0
--- €
2019
1
114 €
0
--- €
2018
0
--- €
0
--- €
2017
1
398 €
0
--- €
2016
0
--- €
0
--- €
2015
1
523 €
0
--- €
2014
2
884 €
0
--- €
Analysis
Structure of prices per m²
Values of price percentiles per m² over the periods used for the estimated price of each type of property.
Structure of transaction amounts
Values of transaction amounts percentiles over the periods used for the estimated price of each type of property.
Transaction amounts and prices per m² by percentile
Percentile
house
Price per m²
Price per m²
house
Transaction amount
Transaction amount
apt.
Price per m²
Price per m²
apt.
Transaction amount
Transaction amount
10th percentile
159 €
13 250 €
--- €
--- €
20th percentile
203 €
14 000 €
--- €
--- €
30th percentile
248 €
14 750 €
--- €
--- €
40th percentile
282 €
16 200 €
--- €
--- €
50th percentile
310 €
18 000 €
--- €
--- €
60th percentile
338 €
19 800 €
--- €
--- €
70th percentile
370 €
26 200 €
--- €
--- €
80th percentile
409 €
41 800 €
--- €
--- €
90th percentile
448 €
57 400 €
--- €
--- €
National and departmental comparison
Evolution of the median price per m² of houses
Evolution of the median price per m² of apartments
Quarterly evolution
Evolution of the median price per m²
Evolution of the number of transactions
Quarterly data
Quarter
house
transactions
transactions
house
Price per m²
Price per m²
apt.
transactions
transactions
apt.
Price per m²
Price per m²
2024 Q3
1
487 €
0
--- €
2023 Q4
1
357 €
0
--- €
2021 Q4
1
263 €
0
--- €
2019 Q1
1
114 €
0
--- €
2017 Q1
1
398 €
0
--- €
2015 Q4
1
523 €
0
--- €
2014 Q1
2
884 €
0
--- €
Overview of the latest real estate transactions
The following list is an anonymized overview of the latest transactions. For more details and to find all transactions, please use the map to view transactions by plot or the transaction search page for a search by criteria.
2024-11-05
21 298 €Sale
Land
2369 m2
-Taillis simples
Land
16341 m2
-Prés
Land
8170 m2
-Prés
Land
13167 m2
-Terres
Land
6424 m2
-Prés
Land
12847 m2
-Prés
Land
8740 m2
-Prés
Land
1594 m2
-Taillis simples
Land
17326 m2
-Prés
2024-08-01
73 000 €487 € /m²(150 m²)
Sale
House
4 rooms
150 m2
Land
725 m2
-Sols
Land
48 m2
-Sols
Land
377 m2
-Vergers
2024-03-19
4 090 €Sale
Land
1840 m2
-Taillis sous futaie
Land
7530 m2
-Terres
Land
11080 m2
-Terres
2023-10-24
15 000 €357 € /m²(42 m²)
Sale
House
2 rooms
42 m2
Land
2810 m2
-Terres
Land
790 m2
-Sols
Land
1060 m2
-Terres
2023-06-21
1 500 €Sale
Land
3880 m2
-Terres
2022-09-27
2 000 €Sale
Land
873 m2
-Landes
/Friche
2022-02-25
189 525 €1 723 € /m²(110 m²)
6 318 € /m²(30 m²)
Sale
House
2 rooms
30 m2
Commercial property
80 m2
Land
344 m2
-Sols
Land
827 m2
-Vergers
2021-12-21
21 000 €263 € /m²(80 m²)
Sale
House
2 rooms
80 m2
Land
258 m2
-Sols
Land
240 m2
-Sols
Land
616 m2
-Sols
Land
145 m2
-Vergers
Land
359 m2
-Sols
Land
230 m2
-Prés
2021-07-22
1 200 €Sale
Land
4894 m2
-Landes
/Friche
2019-01-25
12 500 €114 € /m²(110 m²)
Sale
House
3 rooms
110 m2
Land
741 m2
-Sols
Land
263 m2
-Prés
2018-03-26
5 000 €Sale
Land
87 m2
-Sols
Land
368 m2
-Sols
2017-03-20
35 000 €398 € /m²(88 m²)
Sale
House
3 rooms
88 m2
Land
405 m2
-Sols
Land
2275 m2
-Terres
2015-10-28
46 000 €523 € /m²(88 m²)
Sale
House
3 rooms
88 m2
Land
2161 m2
-Prés
Land
800 m2
-Sols
Land
120 m2
-Terres
Land
148 m2
-Sols
Land
57 m2
-Sols
Land
547 m2
-Terres
2015-09-03
6 480 €Sale
Land
4900 m2
-Terres
Land
15090 m2
-Terres
Land
9950 m2
-Prés
Land
8060 m2
-Terres
Land
2120 m2
-Taillis simples
Land
3080 m2
-Terres
2015-08-01
37 400 €Sale
Land
34234 m2
-Prés
Land
17116 m2
-Prés
Land
16160 m2
-Taillis simples
Land
2400 m2
-Taillis simples
Land
1740 m2
-Terres
Land
43890 m2
-Terres
Land
15120 m2
-Terres
Land
3210 m2
-Terres
Land
1850 m2
-Taillis simples
Land
19860 m2
-Terres
Land
3260 m2
-Taillis simples
Land
11779 m2
-Terres
2014-12-24
4 800 €Sale
Land
15890 m2
-Prés
Land
880 m2
-Landes
/Friche
Land
17930 m2
-Prés
2014-09-23
16 000 €Sale
Land
588 m2
-Sols
Land
4732 m2
-Terres
2014-03-31
120 000 €1 304 € /m²(92 m²)
Sale
House
3 rooms
92 m2
Land
515 m2
-Sols
2014-03-04
50 000 €463 € /m²(108 m²)
Sale
House
3 rooms
108 m2
Land
379 m2
-Sols
Land
278 m2
-Vergers
Land
365 m2
-Vergers
Land
172 m2
-Vergers
Land
74 m2
-Sols
Land
30 m2
-Vergers
Land
441 m2
-Vergers
Land
229 m2
-Sols
19 transactions listed in the municipality
Compare with neighboring municipalities
City
name
name
house
Price per m²
Price per m²
apt.
Price per m²
Price per m²
City information
Zip code
- 70210 HURECOURT
Data source & update
- Latest publication of the property value request (DVF) database made available by the DGFiP on October 19, 2025, covering transactions up to 06/30/2025:
- Administrative/cadastral division as of September 1, 2025, and municipal movements as of January 1, 2025: