emooki
HomePrice mapTransactions
🇬🇧 English🇫🇷 Français🇩🇪 Deutsch🇪🇸 Español🇮🇹 Italiano

Real estate price map


Real estate price map in the municipality of Saint-Genis-les-Ollières, choose a section to see transactions by parcel.

Rhône (69)
Saint-Genis-les-Ollières

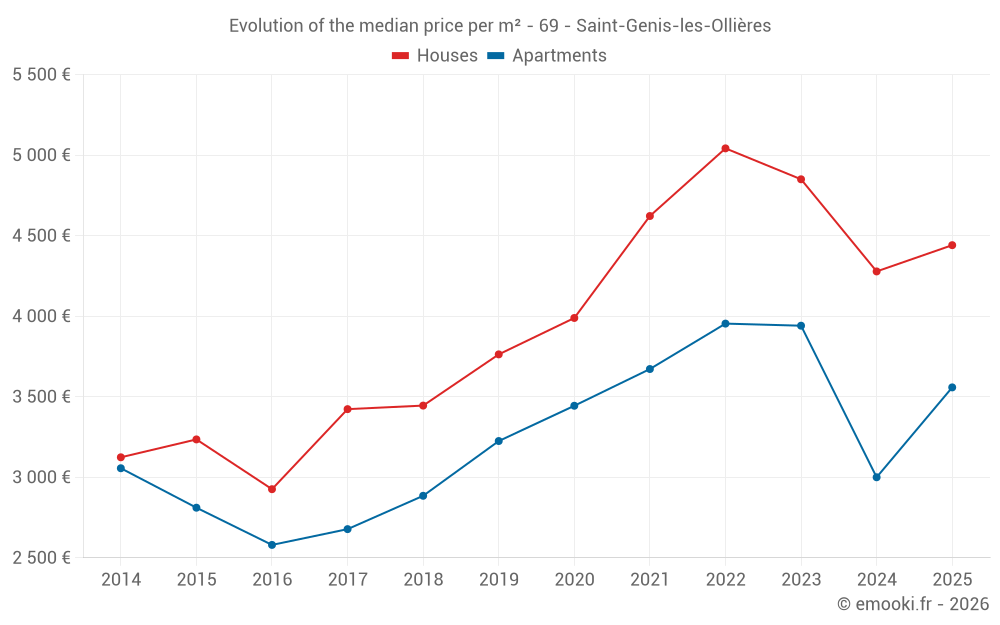
Median price of real estate
in the municipality of Saint-Genis-les-Ollières

HousesHouses
4 441  /m²
1-23-45-67-89-10
Reliability 9/10
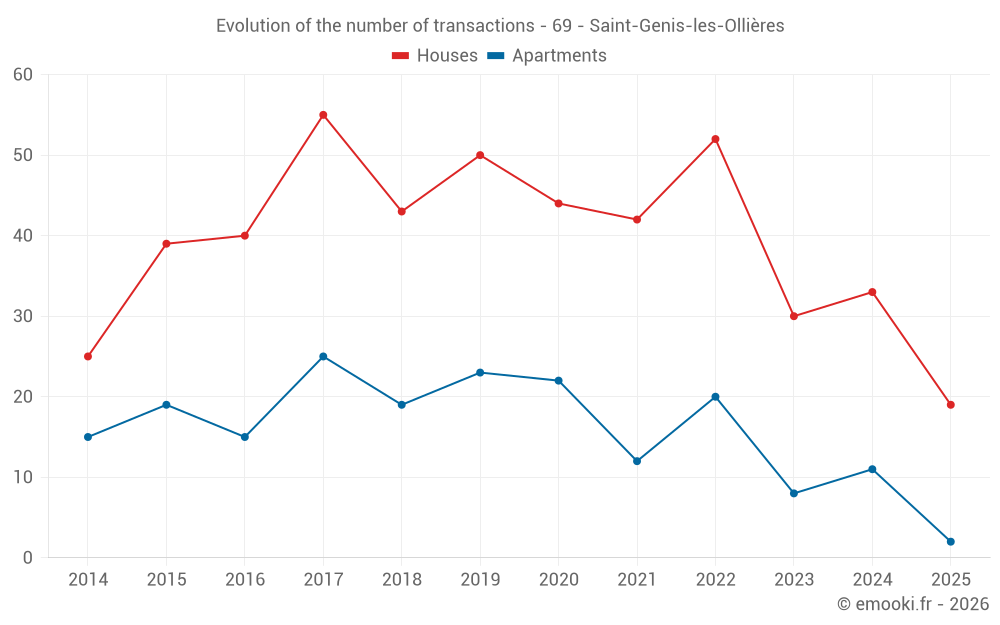
Median price on the 19 transactions of the last 6 months.
from 3 830 to
5 142  /m²
60% of transactions from the 2nd to the 8th deciles.
ApartmentsApartments
3 328  /m²
1-23-45-67-89-10
Reliability 7/10
Median price on the 16 transactions of the last 24 months.
from 2 418 to
4 149  /m²
60% of transactions from the 2nd to the 8th deciles.
DwellingsDwellings
4 437  /m²
1-23-45-67-89-10
Reliability 9/10
Median price on the 21 transactions of the last 6 months.
from 3 550 to
5 088  /m²
60% of transactions from the 2nd to the 8th deciles.
HousesEvolution of the price per m² of houses since...
1 year
+3.8%
2 years
-8.4%
3 years
-12%
4 years
-3.9%
5 years
+11%
6 years
+18%
7 years
+29%
8 years
+30%
9 years
+52%
10 years
+37%
11 years
+42%
The price per m² of houses has decreased by 12% since 3 years, but it has increased by 52% in 9 years.

Yearly evolution

Evolution of the median price per m²

Evolution of the number of transactions

Warning, last year incomplete. Projections made based on the proportions between semesters of the previous year at the departmental/national level and by type of property.

Yearly data

Descending order
Year
Houses
house
transactions
Houses
house
Price per m²
Apartments
apt.
transactions
Apartments
apt.
Price per m²
2025
19
4 441 
2
3 558 
2024
33
4 278 
11
3 000 
2023
30
4 850 
8
3 941 
2022
52
5 042 
20
3 954 
2021
42
4 622 
12
3 672 
2020
44
3 989 
22
3 444 
2019
50
3 763 
23
3 225 
2018
43
3 445 
19
2 885 
2017
55
3 423 
25
2 678 
2016
40
2 926 
15
2 580 
2015
39
3 235 
19
2 811 
2014
25
3 124 
15
3 056 

Analysis

Structure of prices per m²

Values of price percentiles per m² over the periods used for the estimated price of each type of property.

Structure of transaction amounts

Values of transaction amounts percentiles over the periods used for the estimated price of each type of property.

Transaction amounts and prices per m² by percentile

Ascending order
Percentile
Houses
house
Price per m²
Houses
house
Transaction amount
Apartments
apt.
Price per m²
Apartments
apt.
Transaction amount
10th percentile
3 290 
323 K
2 143 
147 K
20th percentile
3 830 
361 K
2 418 
153 K
30th percentile
4 167 
391 K
2 810 
165 K
40th percentile
4 283 
425 K
3 000 
207 K
50th percentile
4 441 
450 K
3 328 
215 K
60th percentile
4 716 
467 K
3 491 
258 K
70th percentile
4 944 
482 K
3 857 
275 K
80th percentile
5 142 
526 K
4 149 
299 K
90th percentile
5 323 
578 K
4 408 
317 K

National and departmental comparison

Evolution of the median price per m² of houses

Evolution of the median price per m² of apartments

Quarterly evolution

Evolution of the median price per m²

Evolution of the number of transactions

Quarterly data

Descending order
Quarter
Houses
house
transactions
Houses
house
Price per m²
Apartments
apt.
transactions
Apartments
apt.
Price per m²
2025 Q2
8
4 597 
0
--- 
2025 Q1
11
4 437 
2
3 558 
2024 Q4
8
3 820 
2
3 638 
2024 Q3
8
4 414 
2
2 622 
2024 Q2
9
4 222 
5
2 418 
2024 Q1
8
4 416 
2
4 662 
2023 Q4
6
3 936 
2
3 910 
2023 Q3
11
4 717 
1
3 929 
2023 Q2
7
5 281 
2
3 888 
2023 Q1
6
4 956 
3
3 953 
2022 Q4
11
4 831 
3
4 000 
2022 Q3
18
5 352 
8
3 980 
2022 Q2
10
4 710 
5
4 607 
2022 Q1
13
5 182 
4
3 747 
2021 Q4
13
6 035 
2
4 026 
2021 Q3
11
4 573 
3
3 582 
2021 Q2
9
4 416 
1
3 629 
2021 Q1
9
4 554 
6
3 956 
2020 Q4
13
4 578 
4
3 490 
2020 Q3
15
3 855 
5
3 200 
2020 Q2
10
3 842 
7
3 836 
2020 Q1
6
3 960 
6
3 288 
2019 Q4
11
3 846 
4
3 615 
2019 Q3
15
3 889 
3
3 355 
2019 Q2
15
3 631 
8
3 206 
2019 Q1
9
3 600 
8
2 818 
2018 Q4
13
3 795 
5
2 690 
2018 Q3
10
3 673 
5
2 672 
2018 Q2
11
3 397 
6
2 764 
2018 Q1
9
2 883 
3
3 094 
2017 Q4
13
3 780 
5
2 680 
2017 Q3
14
3 310 
9
2 859 
2017 Q2
15
3 478 
3
3 042 
2017 Q1
13
3 336 
8
2 348 
2016 Q4
16
3 023 
4
2 034 
2016 Q3
9
3 347 
7
2 120 
2016 Q2
8
2 620 
2
2 779 
2016 Q1
7
2 556 
2
2 658 
2015 Q4
8
3 060 
6
2 384 
2015 Q3
14
3 440 
3
2 826 
2015 Q2
9
3 278 
7
2 811 
2015 Q1
8
3 218 
3
3 017 
2014 Q4
6
2 991 
2
2 586 
2014 Q3
7
3 265 
3
3 021 
2014 Q2
4
3 881 
4
3 382 
2014 Q1
8
2 693 
6
2 650 

Overview of the latest real estate transactions

The following list is an anonymized overview of the latest transactions. For more details and to find all transactions, please use the map to view transactions by plot or the transaction search page for a search by criteria.

2025-06-19
470 700 
4 441  /m²(106 m²)
Sale
Houses
House
5 rooms
106 m2
2025-06-16
423 000 
4 753  /m²(89 m²)
Sale
Houses
House
4 rooms
89 m2
Land
344 m2
-Sols
2025-05-28
318 000 
Sale
Land
96 m2
-Sols
Land
664 m2
-Terres
Land
61 m2
-Sols
2025-05-27
451 560 
4 220  /m²(107 m²)
Sale
Houses
House
5 rooms
107 m2
Land
374 m2
-Sols
Land
124 m2
-Sols
Land
68 m2
-Sols
2025-04-30
541 800 
5 364  /m²(101 m²)
Sale
Houses
House
4 rooms
101 m2
Land
550 m2
-Sols
Land
3062 m2
-Sols
Land
148 m2
-Sols
2025-04-30
479 800 
3 309  /m²(145 m²)
Sale
Houses
House
4 rooms
145 m2
Land
500 m2
-Sols
Land
1874 m2
-Terrains d'agrément
/Parc
Land
3062 m2
-Sols
2025-04-28
315 000 
Sale
Land
772 m2
-Terrains à bâtir
Land
66 m2
-Terrains à bâtir
2025-04-14
484 050 
5 439  /m²(89 m²)
Sale
Houses
House
4 rooms
89 m2
Land
561 m2
-Sols
2025-04-10
180 000 
2 571  /m²(70 m²)
Sale
Houses
House
3 rooms
70 m2
Land
46 m2
-Sols
Land
80 m2
-Sols
2025-04-09
350 000 
5 224  /m²(67 m²)
Sale
Houses
House
4 rooms
67 m2
Land
748 m2
-Sols
2025-03-31
390 450 
3 550  /m²(110 m²)
Sale
Houses
House
4 rooms
110 m2
Land
165 m2
-Sols
2025-03-14
603 375 
4 789  /m²(126 m²)
Sale
Commercial property
Land
67 m2
-Sols
Houses
House
4 rooms
126 m2
Land
314 m2
-Sols
Land
960 m2
-Terrains d'agrément
/Parc
Land
4264 m2
-Terrains d'agrément
/Parc
Land
1543 m2
-Sols
Land
4949 m2
-Sols
Land
3142 m2
-Terrains d'agrément
/Parc
Land
443 m2
-Sols
Land
265 m2
-Terrains d'agrément
/Parc
2025-03-07
225 000 
3 214  /m²(70 m²)
Sale
Houses
House
4 rooms
70 m2
1 outbuilding
Land
929 m2
-Sols
Land
10 m2
-Sols
2025-02-28
392 440 
4 131  /m²(95 m²)
Sale
Land
21 m2
-Sols
Land
61 m2
-Sols
Houses
House
4 rooms
95 m2
Land
181 m2
-Sols
Land
278 m2
-Sols
2025-02-27
368 270 
4 437  /m²(83 m²)
Sale
Houses
House
4 rooms
83 m2
Land
274 m2
-Sols
2025-02-27
347 150 
4 568  /m²(76 m²)
Sale
Houses
House
3 rooms
76 m2
Land
768 m2
-Sols
2025-02-26
299 050 
2 744  /m²(109 m²)
Sale
Apartments
Apartment
3 rooms
109 m2
2 outbuildings
2025-02-24
515 400 
5 313  /m²(97 m²)
Sale
Houses
House
4 rooms
97 m2
Land
392 m2
-Sols
Land
464 m2
-Terrains d'agrément
/Parc
Land
172 m2
-Jardins
2025-02-20
258 000 
4 373  /m²(59 m²)
Sale
Apartments
Apartment
3 rooms
59 m2
2025-02-19
15 000 
Sale
1 outbuilding
1005 transactions listed in the municipality

Rhône (69)

Most expensive cities

City
name
Descending orderHouses
house
Price per m²
5 868 
5 484 
City
name
Descending orderApartments
apt.
Price per m²
4 729 
4 719 
4 505 

Least expensive cities

City
name
Ascending orderHouses
house
Price per m²
744 
915 
1 250 
1 260 
City
name
Ascending orderApartments
apt.
Price per m²
428 
470 
529 
593