emooki
HomePrice mapTransactions
🇬🇧 English🇫🇷 Français🇩🇪 Deutsch🇪🇸 Español🇮🇹 Italiano

Real estate price map


Real estate price map in the municipality of Sainte-Consorce, choose a section to see transactions by parcel.

Rhône (69)

Sainte-Consorce - Real estate price m²

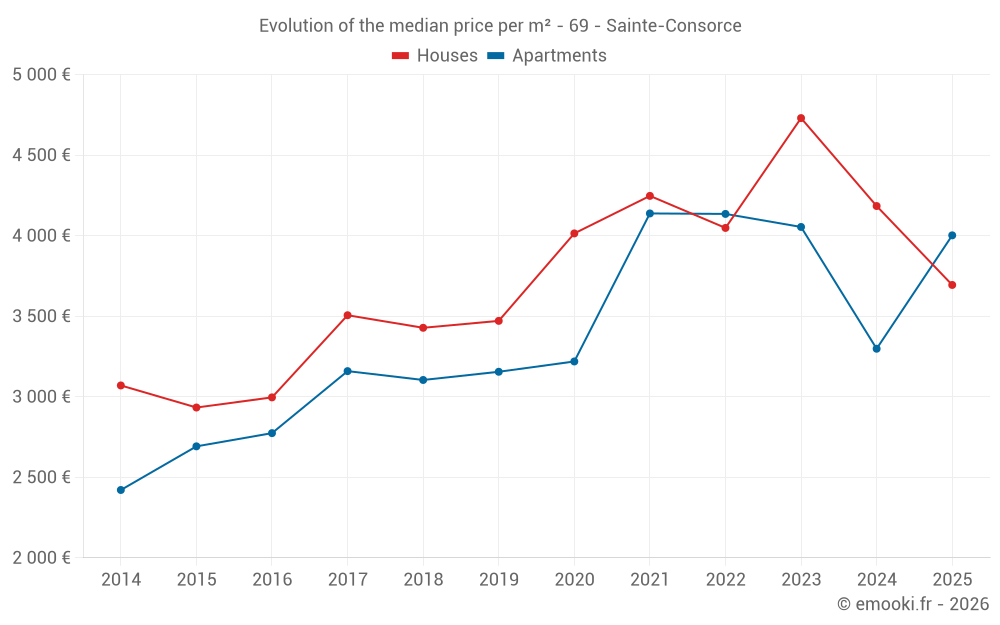
Median price of real estate
in the municipality of Sainte-Consorce

HousesHouses
3 954  /m²
1-23-45-67-89-10
Reliability 7/10
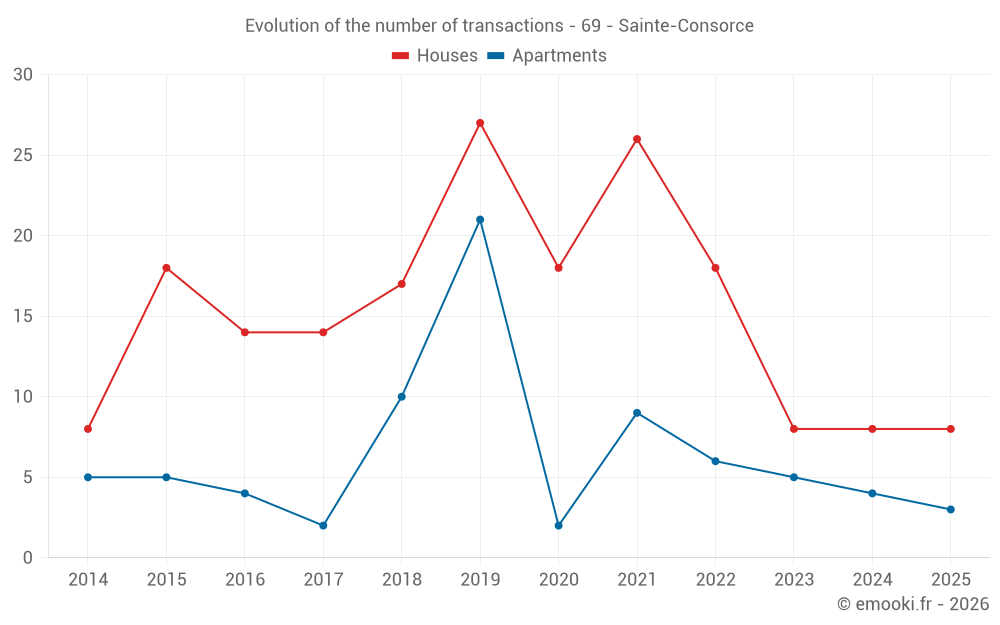
Median price on the 20 transactions of the last 24 months.
from 2 937 to
4 668  /m²
60% of transactions from the 2nd to the 8th deciles.
ApartmentsApartments
3 972  /m²
1-23-45-67-89-10
Reliability 6/10
Median price on the 14 transactions of the last 36 months.
from 3 475 to
4 746  /m²
60% of transactions from the 2nd to the 8th deciles.
DwellingsDwellings
4 002  /m²
1-23-45-67-89-10
Reliability 8/10
Median price on the 17 transactions of the last 12 months.
from 3 014 to
4 603  /m²
60% of transactions from the 2nd to the 8th deciles.
HousesEvolution of the price per m² of houses since...
1 year
-12%
2 years
-22%
3 years
-8.7%
4 years
-13%
5 years
-8%
6 years
+6.4%
7 years
+7.8%
8 years
+5.4%
9 years
+23%
10 years
+26%
11 years
+20%
The price per m² of houses has decreased by 22% since 2 years, but it has increased by 26% in 10 years.

Yearly evolution

Evolution of the median price per m²

Evolution of the median price per m² - 69 - Sainte-Consorce

Evolution of the number of transactions

Warning, last year incomplete. Projections made based on the proportions between semesters of the previous year at the departmental/national level and by type of property.

Evolution of the number of transactions - 69 - Sainte-Consorce

Yearly data

Descending order
Year
Houses
house
transactions
Houses
house
Price per m²
Apartments
apt.
transactions
Apartments
apt.
Price per m²
2025
8
3 694 
3
4 002 
2024
8
4 184 
4
3 298 
2023
8
4 730 
5
4 054 
2022
18
4 048 
6
4 135 
2021
26
4 247 
9
4 138 
2020
18
4 014 
2
3 219 
2019
27
3 471 
21
3 155 
2018
17
3 428 
10
3 104 
2017
14
3 506 
2
3 159 
2016
14
2 996 
4
2 774 
2015
18
2 933 
5
2 692 
2014
8
3 070 
5
2 421 

Analysis

Structure of prices per m²

Values of price percentiles per m² over the periods used for the estimated price of each type of property.

Structure of transaction amounts

Values of transaction amounts percentiles over the periods used for the estimated price of each type of property.

Transaction amounts and prices per m² by percentile

Ascending order
Percentile
Houses
house
Price per m²
Houses
house
Transaction amount
Apartments
apt.
Price per m²
Apartments
apt.
Transaction amount
10th percentile
2 798 
145 K
2 873 
183 K
20th percentile
2 937 
152 K
3 475 
191 K
30th percentile
3 456 
288 K
3 851 
219 K
40th percentile
3 667 
400 K
3 929 
226 K
50th percentile
3 954 
439 K
3 972 
236 K
60th percentile
4 320 
458 K
4 044 
248 K
70th percentile
4 584 
485 K
4 207 
255 K
80th percentile
4 668 
555 K
4 746 
319 K
90th percentile
5 069 
677 K
5 247 
372 K

National and departmental comparison

Evolution of the median price per m² of houses

Evolution of the median price per m² of apartments

Quarterly evolution

Evolution of the median price per m²

Evolution of the number of transactions

Quarterly data

Descending order
Quarter
Houses
house
transactions
Houses
house
Price per m²
Apartments
apt.
transactions
Apartments
apt.
Price per m²
2025 Q2
4
3 959 
0
--- 
2025 Q1
4
3 694 
3
4 002 
2024 Q4
1
4 750 
0
--- 
2024 Q3
5
4 167 
0
--- 
2024 Q2
0
--- 
2
3 298 
2024 Q1
2
4 374 
2
3 030 
2023 Q4
4
4 010 
1
4 426 
2023 Q3
0
--- 
2
3 470 
2023 Q2
2
4 240 
2
4 738 
2023 Q1
2
6 328 
0
--- 
2022 Q4
3
5 077 
1
3 859 
2022 Q3
4
4 395 
1
5 227 
2022 Q2
8
3 950 
3
3 773 
2022 Q1
3
3 889 
1
4 411 
2021 Q4
6
4 282 
2
3 650 
2021 Q3
5
4 837 
2
4 408 
2021 Q2
8
4 342 
3
4 037 
2021 Q1
7
3 910 
2
3 764 
2020 Q4
5
4 200 
1
2 780 
2020 Q3
6
4 668 
1
3 658 
2020 Q2
2
2 726 
0
--- 
2020 Q1
5
3 173 
0
--- 
2019 Q4
8
3 250 
5
3 725 
2019 Q3
7
3 381 
2
3 368 
2019 Q2
4
4 006 
7
3 119 
2019 Q1
8
3 587 
7
3 155 
2018 Q4
3
3 428 
5
3 705 
2018 Q3
7
3 157 
3
2 958 
2018 Q2
4
3 252 
2
2 989 
2018 Q1
3
3 557 
0
--- 
2017 Q4
3
3 474 
1
3 342 
2017 Q3
5
3 539 
0
--- 
2017 Q2
4
3 084 
1
2 976 
2017 Q1
2
3 654 
0
--- 
2016 Q4
2
3 043 
0
--- 
2016 Q3
8
3 064 
2
2 774 
2016 Q2
1
2 533 
1
1 071 
2016 Q1
3
2 040 
1
3 228 
2015 Q4
3
3 173 
1
2 692 
2015 Q3
6
2 947 
1
3 001 
2015 Q2
3
2 941 
1
2 147 
2015 Q1
6
2 460 
2
1 700 
2014 Q4
3
2 271 
0
--- 
2014 Q3
4
3 380 
1
2 893 
2014 Q2
0
--- 
1
2 322 
2014 Q1
1
2 981 
3
2 421 

Overview of the latest real estate transactions

The following list is an anonymized overview of the latest transactions. For more details and to find all transactions, please use the map to view transactions by plot or the transaction search page for a search by criteria.

2025-06-19
507 500 
5 075  /m²(100 m²)
Sale
Houses
House
5 rooms
100 m2
1 outbuilding
Land
2095 m2
-Jardins
Land
256 m2
-Sols
Land
2184 m2
-Prés
Land
931 m2
-Jardins
2025-06-17
320 000 
430  /m²(744 m²)
Sale
Commercial property
744 m2
Land
418 m2
-Sols
Land
529 m2
-Terres
2025-05-23
437 030 
2 586  /m²(169 m²)
Sale
Apartments
Apartment
2 rooms
23 m2
Houses
House
7 rooms
146 m2
2 outbuildings
Land
197 m2
-Sols
2025-04-25
440 000 
3 308  /m²(133 m²)
Sale
Houses
House
5 rooms
133 m2
Land
185 m2
-Sols
Land
1815 m2
-Jardins
2025-04-11
391 890 
4 610  /m²(85 m²)
Sale
Houses
House
4 rooms
85 m2
Land
375 m2
-Sols
Land
214 m2
-Prés
2025-03-25
5 000 
Sale
1 outbuilding
2025-03-25
221 720 
4 183  /m²(53 m²)
Sale
Apartments
Apartment
2 rooms
53 m2
1 outbuilding
2025-03-20
456 000 
3 648  /m²(125 m²)
Sale
Houses
House
5 rooms
125 m2
Land
680 m2
-Sols
2025-02-28
6 000 
Sale
Land
3313 m2
-Prés
Land
20 m2
-Prés
2025-02-28
543 800 
4 648  /m²(117 m²)
Sale
Houses
House
5 rooms
117 m2
2 outbuildings
Land
1212 m2
-Sols
Land
272 m2
-Sols
2025-02-28
185 000 
2 229  /m²(83 m²)
Sale
Commercial property
83 m2
2025-02-26
665 800 
3 740  /m²(178 m²)
Sale
Houses
House
7 rooms
178 m2
1 outbuilding
Land
1053 m2
-Sols
2025-01-10
127 000 
2 822  /m²(45 m²)
Sale
Houses
House
2 rooms
45 m2
2 outbuildings
2025-01-09
244 100 
4 002  /m²(61 m²)
Sale
Apartments
Apartment
3 rooms
61 m2
1 outbuilding
2025-01-09
339 000 
3 942  /m²(86 m²)
Sale
3 outbuildings
Apartments
Apartment
4 rooms
86 m2
2024-12-26
18 500 
Sale
1 outbuilding
2024-12-19
703 000 
3 240  /m²(217 m²)
Sale
Commercial property
217 m2
Land
2000 m2
-Sols
2024-12-10
4 000 
Sale
Land
377 m2
-Prés
2024-12-02
250 000 
511  /m²(489 m²)
2 778  /m²(90 m²)
Sale
Apartments
Apartment
4 rooms
90 m2
Commercial property
275 m2
Commercial property
124 m2
2 outbuildings
Land
408 m2
-Sols
2024-11-20
4 000 
Sale
Land
3200 m2
-Prés
512 transactions listed in the municipality

Rhône (69)

Most expensive cities

City
name
Descending orderHouses
house
Price per m²
5 868 
5 484 
City
name
Descending orderApartments
apt.
Price per m²
4 729 
4 719 
4 505 

Least expensive cities

City
name
Ascending orderHouses
house
Price per m²
744 
915 
1 250 
1 260 
City
name
Ascending orderApartments
apt.
Price per m²
428 
470 
529 
593