emooki
HomePrice mapTransactions
🇬🇧 English🇫🇷 Français🇩🇪 Deutsch🇪🇸 Español🇮🇹 Italiano

Real estate price map


Real estate price map in the municipality of Caluire-et-Cuire, choose a section to see transactions by parcel.

Rhône (69)
Caluire-et-Cuire

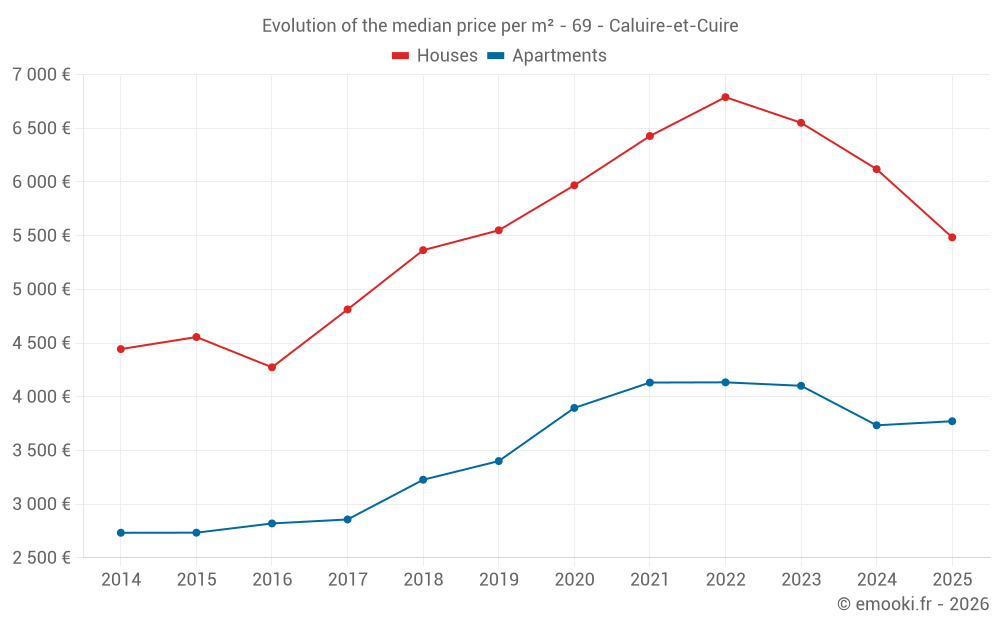
Median price of real estate
in the municipality of Caluire-et-Cuire

HousesHouses
5 484 € /m²
1-23-45-67-89-10
Reliability 9/10
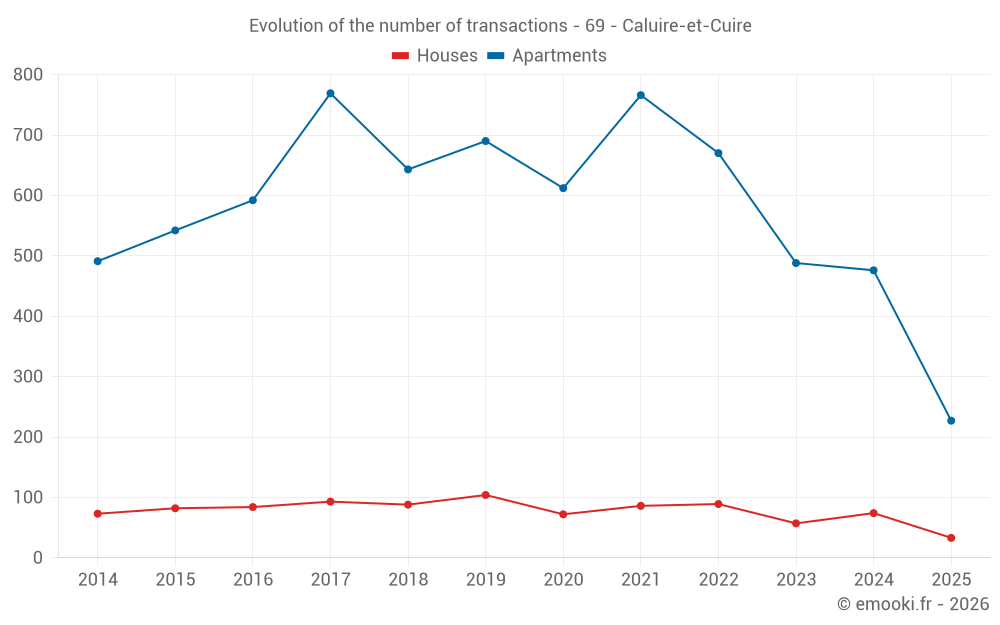
Median price on the 33 transactions of the last 6 months.
from 4 566 to
7 695 € /m²
60% of transactions from the 2nd to the 8th deciles.
ApartmentsApartments
3 860 € /m²
1-23-45-67-89-10
Reliability 10/10
Median price on the 83 transactions of the last 3 months.
from 2 913 to
4 920 € /m²
60% of transactions from the 2nd to the 8th deciles.
DwellingsDwellings
4 150 € /m²
1-23-45-67-89-10
Reliability 10/10
Median price on the 101 transactions of the last 3 months.
from 3 056 to
5 328 € /m²
60% of transactions from the 2nd to the 8th deciles.
HousesEvolution of the price per m² of houses since...
1 year
-10%
2 years
-16%
3 years
-19%
4 years
-15%
5 years
-8.1%
6 years
-1.2%
7 years
+2.2%
8 years
+14%
9 years
+28%
10 years
+20%
11 years
+23%
The price per m² of houses has decreased by 19% since 3 years, but it has increased by 28% in 9 years.
ApartmentsEvolution of the price per m² of apartments since...
1 year
+1%
2 years
-8%
3 years
-8.8%
4 years
-8.7%
5 years
-3.2%
6 years
+11%
7 years
+17%
8 years
+32%
9 years
+34%
10 years
+38%
11 years
+38%
The price per m² of apartments has decreased by 8.8% since 3 years, but it has increased by 38% in 11 years.

Yearly evolution

Evolution of the median price per m²

Evolution of the number of transactions

Warning, last year incomplete. Projections made based on the proportions between semesters of the previous year at the departmental/national level and by type of property.

Yearly data

Descending order
Year
Houses
house
transactions
Houses
house
Price per m²
Apartments
apt.
transactions
Apartments
apt.
Price per m²
2025
33
5 484 €
227
3 772 €
2024
74
6 119 €
476
3 734 €
2023
57
6 551 €
488
4 102 €
2022
89
6 790 €
670
4 134 €
2021
86
6 428 €
766
4 132 €
2020
72
5 969 €
612
3 896 €
2019
104
5 550 €
690
3 401 €
2018
88
5 365 €
643
3 227 €
2017
93
4 813 €
769
2 857 €
2016
84
4 274 €
592
2 820 €
2015
82
4 556 €
542
2 734 €
2014
73
4 444 €
491
2 733 €

Analysis

Structure of prices per m²

Values of price percentiles per m² over the periods used for the estimated price of each type of property.

Structure of transaction amounts

Values of transaction amounts percentiles over the periods used for the estimated price of each type of property.

Transaction amounts and prices per m² by percentile

Ascending order
Percentile
Houses
house
Price per m²
Houses
house
Transaction amount
Apartments
apt.
Price per m²
Apartments
apt.
Transaction amount
10th percentile
3 280 €
360 K€
2 611 €
121 K€
20th percentile
4 566 €
405 K€
2 913 €
159 K€
30th percentile
5 114 €
503 K€
3 370 €
191 K€
40th percentile
5 335 €
548 K€
3 554 €
214 K€
50th percentile
5 484 €
650 K€
3 860 €
231 K€
60th percentile
5 822 €
773 K€
4 243 €
250 K€
70th percentile
7 078 €
817 K€
4 642 €
287 K€
80th percentile
7 695 €
864 K€
4 920 €
321 K€
90th percentile
7 911 €
1 054 K€
5 435 €
389 K€

National and departmental comparison

Evolution of the median price per m² of houses

Evolution of the median price per m² of apartments

Quarterly evolution

Evolution of the median price per m²

Evolution of the number of transactions

Quarterly data

Descending order
Quarter
Houses
house
transactions
Houses
house
Price per m²
Apartments
apt.
transactions
Apartments
apt.
Price per m²
2025 Q2
18
5 479 €
83
3 860 €
2025 Q1
15
5 484 €
144
3 744 €
2024 Q4
27
5 808 €
128
3 726 €
2024 Q3
23
5 688 €
133
3 629 €
2024 Q2
15
6 292 €
103
3 750 €
2024 Q1
9
6 680 €
112
3 786 €
2023 Q4
14
5 568 €
95
4 037 €
2023 Q3
18
6 652 €
110
4 135 €
2023 Q2
17
6 909 €
151
4 100 €
2023 Q1
8
6 482 €
132
4 106 €
2022 Q4
19
6 552 €
164
4 116 €
2022 Q3
32
6 704 €
170
4 304 €
2022 Q2
24
6 506 €
187
4 130 €
2022 Q1
14
7 767 €
149
4 070 €
2021 Q4
21
7 303 €
173
4 375 €
2021 Q3
22
7 145 €
231
4 177 €
2021 Q2
26
5 770 €
198
4 108 €
2021 Q1
17
5 773 €
164
3 801 €
2020 Q4
16
5 506 €
191
3 913 €
2020 Q3
20
6 688 €
164
3 971 €
2020 Q2
19
5 545 €
128
3 984 €
2020 Q1
17
6 131 €
129
3 824 €
2019 Q4
27
4 925 €
166
3 548 €
2019 Q3
26
5 924 €
192
3 478 €
2019 Q2
30
5 846 €
161
3 344 €
2019 Q1
21
5 231 €
171
3 162 €
2018 Q4
16
5 505 €
151
3 294 €
2018 Q3
28
5 496 €
188
3 400 €
2018 Q2
26
5 326 €
165
3 250 €
2018 Q1
18
4 900 €
139
3 000 €
2017 Q4
22
5 196 €
187
2 891 €
2017 Q3
27
4 813 €
207
3 000 €
2017 Q2
16
5 203 €
199
2 813 €
2017 Q1
28
4 357 €
176
2 832 €
2016 Q4
24
4 518 €
139
2 857 €
2016 Q3
24
4 610 €
184
2 952 €
2016 Q2
16
3 712 €
145
2 736 €
2016 Q1
20
4 002 €
124
2 689 €
2015 Q4
22
4 732 €
162
2 762 €
2015 Q3
23
4 764 €
150
2 686 €
2015 Q2
20
4 556 €
128
2 788 €
2015 Q1
17
4 347 €
102
2 812 €
2014 Q4
26
4 151 €
107
2 647 €
2014 Q3
20
4 076 €
166
2 883 €
2014 Q2
11
4 501 €
99
2 706 €
2014 Q1
16
5 557 €
119
2 670 €

Overview of the latest real estate transactions

The following list is an anonymized overview of the latest transactions. For more details and to find all transactions, please use the map to view transactions by plot or the transaction search page for a search by criteria.

2025-06-30
395 000 €
4 877 € /m²(81 m²)
Sale
Houses
House
5 rooms
81 m2
Land
622 m2
-Sols
Land
54 m2
-Sols
2025-06-27
1 070 000 €
5 722 € /m²(187 m²)
Sale
Houses
House
4 rooms
187 m2
2 outbuildings
Land
500 m2
-Sols
Land
643 m2
-Terrains d'agrément
/Parc
2025-06-26
158 500 €
4 403 € /m²(36 m²)
Sale
Apartments
Apartment
1 room
36 m2
1 outbuilding
2025-06-25
238 910 €
4 594 € /m²(52 m²)
Sale
Apartments
Apartment
3 rooms
52 m2
1 outbuilding
2025-06-24
990 000 €
7 920 € /m²(125 m²)
Sale
Houses
House
6 rooms
125 m2
Land
434 m2
-Terrains d'agrément
/Parc
Land
216 m2
-Sols
2025-06-19
318 600 €
3 251 € /m²(98 m²)
Sale
Apartments
Apartment
4 rooms
98 m2
1 outbuilding
2025-06-19
129 000 €
5 864 € /m²(22 m²)
Sale
Apartments
Apartment
2 rooms
22 m2
2025-06-18
10 000 €
Sale
1 outbuilding
2025-06-18
370 000 €
4 066 € /m²(91 m²)
Sale
2 outbuildings
Apartments
Apartment
4 rooms
91 m2
1 outbuilding
2025-06-18
28 000 €
Sale
1 outbuilding
2025-06-13
15 000 €
Sale
1 outbuilding
2025-06-12
321 000 €
5 177 € /m²(62 m²)
Sale
Apartments
Apartment
3 rooms
62 m2
1 outbuilding
2025-06-11
807 000 €
4 483 € /m²(180 m²)
Sale
Land
1700 m2
-Sols
Houses
House
7 rooms
180 m2
2 outbuildings
Land
795 m2
-Sols
Land
736 m2
-Prés
2025-06-11
18 000 €
Sale
1 outbuilding
2025-06-10
390 200 €
4 759 € /m²(82 m²)
Sale
Apartments
Apartment
3 rooms
82 m2
2 outbuildings
2025-06-10
41 580 €
Sale
2025-06-04
35 000 €
Sale
1 outbuilding
2025-06-04
93 000 €
3 100 € /m²(30 m²)
Sale
Apartments
Apartment
1 room
30 m2
2025-06-03
195 000 €
2 868 € /m²(68 m²)
Sale
Apartments
Apartment
2 rooms
68 m2
1 outbuilding
2025-06-03
480 000 €
4 948 € /m²(97 m²)
Sale
Apartments
Apartment
3 rooms
97 m2
1 outbuilding
10950 transactions listed in the municipality

Rhône (69)

Most expensive cities

City
name
Descending orderHouses
house
Price per m²
8 086 €
7 283 €
6 120 €
5 946 €
5 868 €
5 739 €
5 654 €
5 529 €
5 484 €
5 467 €
City
name
Descending orderApartments
apt.
Price per m²
5 536 €
5 308 €
5 064 €
4 817 €
4 729 €
4 719 €
4 717 €
4 627 €
4 571 €
4 505 €

Least expensive cities

City
name
Ascending orderHouses
house
Price per m²
744 €
915 €
1 104 €
1 250 €
1 250 €
1 250 €
1 260 €
1 291 €
1 351 €
1 360 €
City
name
Ascending orderApartments
apt.
Price per m²
428 €
460 €
470 €
529 €
581 €
593 €
650 €
667 €