Median price of real estate
in the municipality of Tassin-la-Demi-Lune
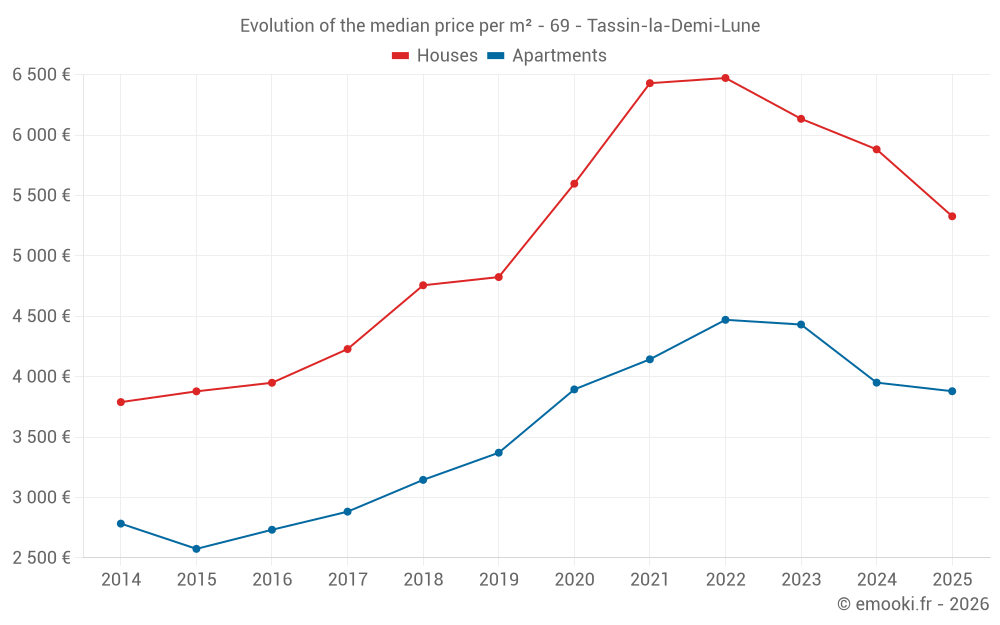
Houses
5 327 € /m²
Reliability 9/10
Median price on the 20 transactions of the last 6 months.
from 3 760 to
6 706 € /m²
6 706 € /m²
60% of transactions from the 2nd to the 8th deciles.
Apartments
3 846 € /m²
Reliability 10/10
Median price on the 41 transactions of the last 3 months.
from 2 873 to
4 612 € /m²
4 612 € /m²
60% of transactions from the 2nd to the 8th deciles.
Dwellings
3 879 € /m²
Reliability 10/10
Median price on the 49 transactions of the last 3 months.
from 2 857 to
4 734 € /m²
4 734 € /m²
60% of transactions from the 2nd to the 8th deciles.