Median price of real estate
in the municipality of Pollionnay
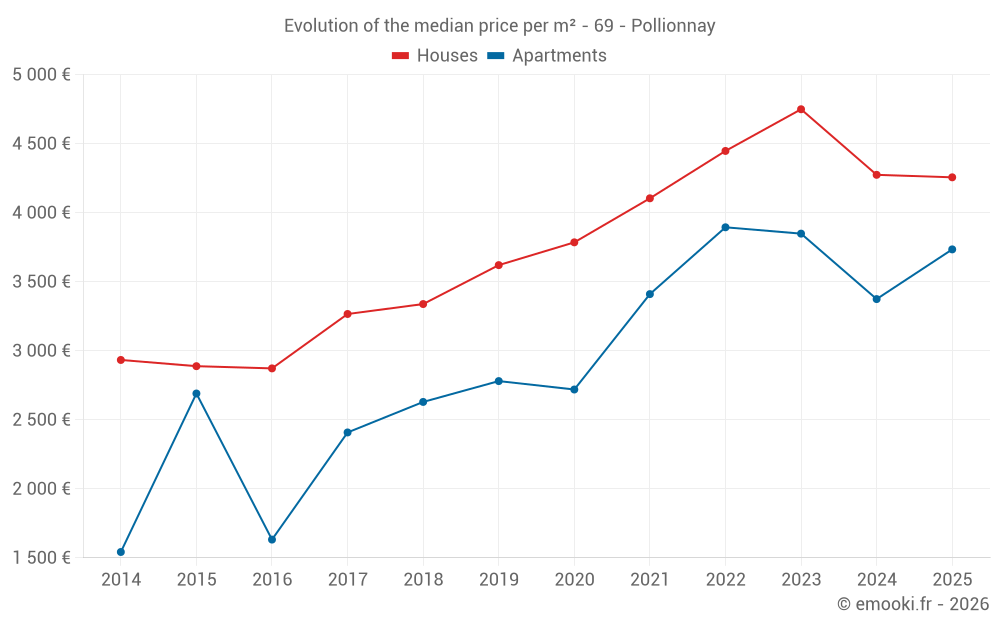
Houses
4 274 € /m²
Reliability 7/10
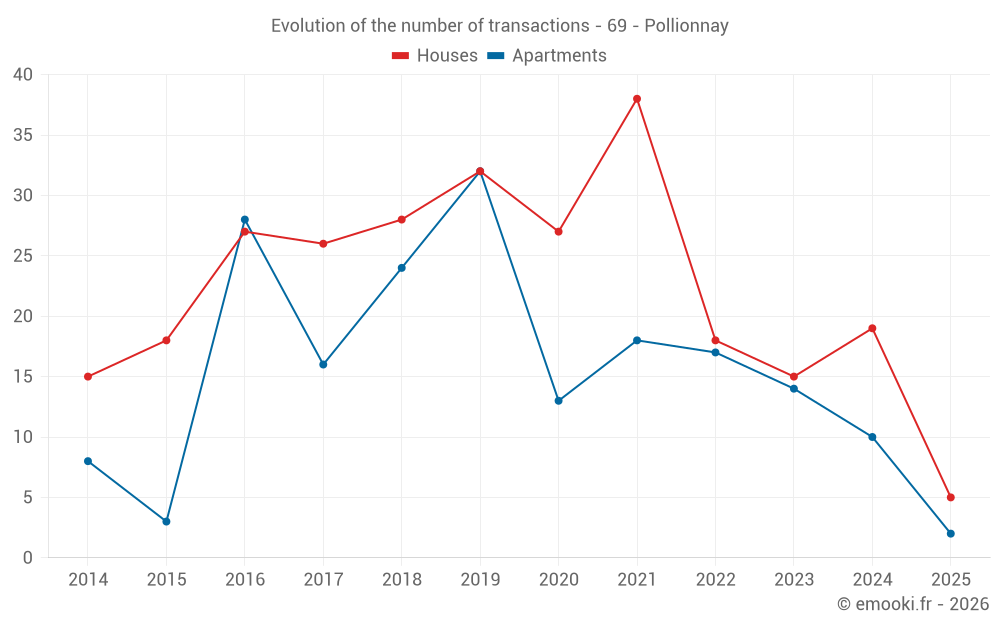
Median price on the 29 transactions of the last 24 months.
from 3 349 to
5 011 € /m²
5 011 € /m²
60% of transactions from the 2nd to the 8th deciles.
Apartments
3 488 € /m²
Reliability 7/10
Median price on the 16 transactions of the last 24 months.
from 3 073 to
4 049 € /m²
4 049 € /m²
60% of transactions from the 2nd to the 8th deciles.
Dwellings
3 991 € /m²
Reliability 8/10
Median price on the 21 transactions of the last 12 months.
from 3 394 to
4 469 € /m²
4 469 € /m²
60% of transactions from the 2nd to the 8th deciles.