emooki
HomePrice mapTransactions
🇬🇧 English🇫🇷 Français🇩🇪 Deutsch🇪🇸 Español🇮🇹 Italiano

Real estate price map


Real estate price map in the municipality of Trie-Château, choose a section to see transactions by parcel.

Oise (60)
Trie-Château

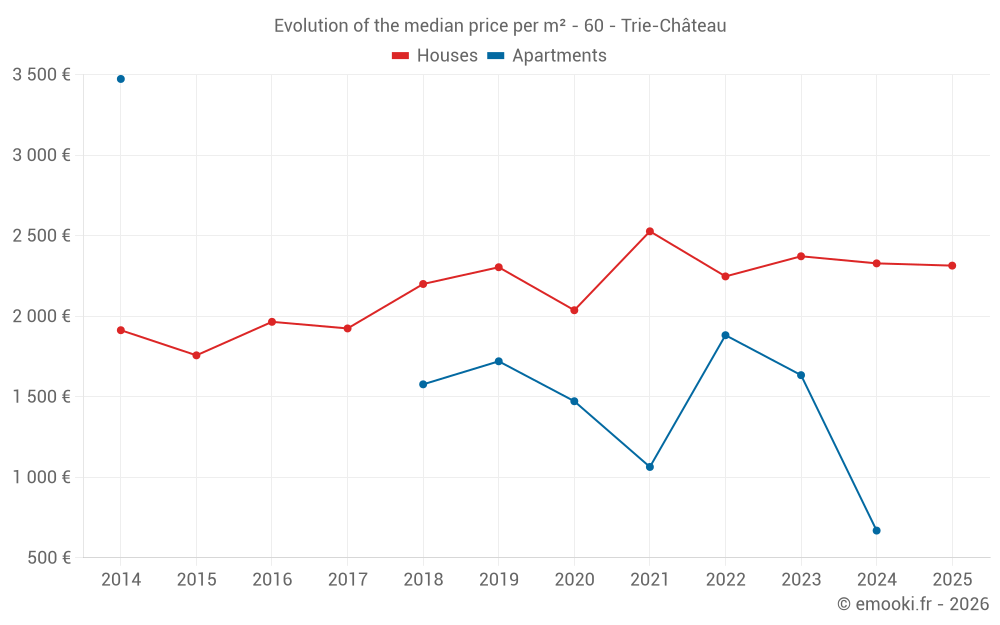
Median price of real estate
in the municipality of Trie-Château

HousesHouses
2 206  /m²
1-23-45-67-89-10
Reliability 8/10
Median price on the 22 transactions of the last 12 months.
from 1 855 to
2 740  /m²
60% of transactions from the 2nd to the 8th deciles.
ApartmentsApartments
1 426  /m²
1-23-45-67-89-10
Reliability 4/10
Median price on the 10 transactions of the last 60 months.
DwellingsDwellings
2 206  /m²
1-23-45-67-89-10
Reliability 8/10
Median price on the 22 transactions of the last 12 months.
from 1 855 to
2 740  /m²
60% of transactions from the 2nd to the 8th deciles.
HousesEvolution of the price per m² of houses since...
1 year
-0.6%
2 years
-2.4%
3 years
+3%
4 years
-8.4%
5 years
+14%
6 years
+0.4%
7 years
+5.2%
8 years
+20%
9 years
+18%
10 years
+32%
11 years
+21%
The price per m² of houses has decreased by 8.4% since 4 years, but it has increased by 32% in 10 years.

Yearly evolution

Evolution of the median price per m²

Evolution of the number of transactions

Warning, last year incomplete. Projections made based on the proportions between semesters of the previous year at the departmental/national level and by type of property.

Yearly data

Descending order
Year
Houses
house
transactions
Houses
house
Price per m²
Apartments
apt.
transactions
Apartments
apt.
Price per m²
2025
10
2 314 
0
--- 
2024
20
2 328 
1
669 
2023
18
2 372 
1
1 634 
2022
21
2 247 
3
1 882 
2021
49
2 527 
3
1 064 
2020
24
2 037 
3
1 472 
2019
33
2 304 
5
1 720 
2018
30
2 200 
1
1 577 
2017
27
1 924 
0
--- 
2016
25
1 965 
0
--- 
2015
14
1 757 
0
--- 
2014
19
1 913 
2
3 473 

Analysis

Structure of prices per m²

Values of price percentiles per m² over the periods used for the estimated price of each type of property.

Structure of transaction amounts

Values of transaction amounts percentiles over the periods used for the estimated price of each type of property.

Transaction amounts and prices per m² by percentile

Ascending order
Percentile
Houses
house
Price per m²
Houses
house
Transaction amount
Apartments
apt.
Price per m²
Apartments
apt.
Transaction amount
10th percentile
1 831 
137 K
889 
75 200 
20th percentile
1 855 
157 K
1 034 
79 904 
30th percentile
1 965 
198 K
1 226 
87 814 
40th percentile
2 106 
220 K
1 347 
91 300 
50th percentile
2 206 
241 K
1 426 
93 810 
60th percentile
2 444 
250 K
1 484 
97 576 
70th percentile
2 570 
257 K
1 542 
122 K
80th percentile
2 740 
267 K
1 684 
177 K
90th percentile
2 880 
299 K
1 896 
205 K

National and departmental comparison

Evolution of the median price per m² of houses

Evolution of the median price per m² of apartments

Quarterly evolution

Evolution of the median price per m²

Evolution of the number of transactions

Quarterly data

Descending order
Quarter
Houses
house
transactions
Houses
house
Price per m²
Apartments
apt.
transactions
Apartments
apt.
Price per m²
2025 Q2
3
2 167 
0
--- 
2025 Q1
7
2 595 
0
--- 
2024 Q4
5
2 240 
0
--- 
2024 Q3
7
2 062 
0
--- 
2024 Q2
7
2 505 
1
669 
2024 Q1
1
2 589 
0
--- 
2023 Q4
2
2 122 
0
--- 
2023 Q3
7
2 016 
0
--- 
2023 Q2
7
2 378 
0
--- 
2023 Q1
2
2 814 
1
1 634 
2022 Q4
6
2 419 
1
1 882 
2022 Q3
9
2 247 
1
2 023 
2022 Q2
3
2 333 
1
1 296 
2022 Q1
3
1 815 
0
--- 
2021 Q4
15
2 573 
1
913 
2021 Q3
18
2 582 
1
1 064 
2021 Q2
10
2 281 
1
1 381 
2021 Q1
6
2 050 
0
--- 
2020 Q4
7
2 015 
1
1 502 
2020 Q3
6
1 834 
1
1 472 
2020 Q2
4
2 034 
0
--- 
2020 Q1
7
2 258 
1
1 406 
2019 Q4
5
2 043 
1
1 597 
2019 Q3
13
2 304 
3
1 770 
2019 Q2
6
3 110 
1
1 233 
2019 Q1
9
2 105 
0
--- 
2018 Q4
6
2 342 
0
--- 
2018 Q3
5
2 101 
0
--- 
2018 Q2
13
2 209 
1
1 577 
2018 Q1
6
1 872 
0
--- 
2017 Q4
8
1 835 
0
--- 
2017 Q3
9
2 221 
0
--- 
2017 Q2
6
1 744 
0
--- 
2017 Q1
4
1 674 
0
--- 
2016 Q4
5
2 083 
0
--- 
2016 Q3
9
1 600 
0
--- 
2016 Q2
5
1 000 
0
--- 
2016 Q1
6
2 434 
0
--- 
2015 Q4
2
1 994 
0
--- 
2015 Q3
4
1 832 
0
--- 
2015 Q2
4
1 712 
0
--- 
2015 Q1
4
1 630 
0
--- 
2014 Q4
9
2 238 
0
--- 
2014 Q3
3
1 593 
1
4 320 
2014 Q2
4
2 102 
0
--- 
2014 Q1
3
1 913 
1
2 626 

Overview of the latest real estate transactions

The following list is an anonymized overview of the latest transactions. For more details and to find all transactions, please use the map to view transactions by plot or the transaction search page for a search by criteria.

2025-06-11
260 000 
2 167  /m²(120 m²)
Sale
Houses
House
7 rooms
120 m2
Land
1555 m2
-Terrains à bâtir
2025-05-30
261 000 
2 462  /m²(106 m²)
Sale
Houses
House
6 rooms
106 m2
Land
1040 m2
-Sols
Land
72 m2
-Terrains à bâtir
2025-05-27
290 000 
812  /m²(357 m²)
Sale
Apartments
Apartment
3 rooms
50 m2
Apartments
Apartment
2 rooms
30 m2
Apartments
Apartment
1 room
35 m2
Apartments
Apartment
3 rooms
30 m2
Apartments
Apartment
1 room
30 m2
Apartments
Apartment
3 rooms
50 m2
Land
269 m2
-Sols
Houses
House
5 rooms
132 m2
Land
500 m2
-Sols
Land
746 m2
-Jardins
/CRESS
Land
28 m2
-Sols
2025-04-29
175 000 
1 923  /m²(91 m²)
Sale
Houses
House
5 rooms
91 m2
Land
220 m2
-Sols
2025-04-22
177 000 
1 487  /m²(119 m²)
2 082  /m²(85 m²)
Sale
Houses
House
3 rooms
85 m2
Commercial property
34 m2
2 outbuildings
Land
155 m2
-Sols
Land
15 m2
-Sols
Land
7 m2
-Sols
2025-03-27
213 000 
1 852  /m²(115 m²)
Sale
Houses
House
4 rooms
115 m2
Land
685 m2
-Sols
Land
2600 m2
-Prés
2025-03-21
250 000 
2 066  /m²(121 m²)
Sale
Houses
House
5 rooms
121 m2
Land
500 m2
-Sols
Land
1593 m2
-Jardins
2025-03-14
350 000 
2 692  /m²(130 m²)
Sale
Houses
House
4 rooms
130 m2
1 outbuilding
Land
656 m2
-Sols
Land
1450 m2
-Jardins
2025-03-12
205 000 
2 595  /m²(79 m²)
Sale
Houses
House
4 rooms
79 m2
2 outbuildings
Land
661 m2
-Sols
2025-02-07
240 000 
3 200  /m²(75 m²)
Sale
Houses
House
3 rooms
75 m2
Land
703 m2
-Sols
2025-01-27
242 000 
2 881  /m²(84 m²)
Sale
Houses
House
5 rooms
84 m2
Land
645 m2
-Sols
2025-01-17
75 000 
Sale
Land
190 m2
-Taillis simples
Land
10000 m2
-Herbages
Land
302 m2
-Terres
Land
740 m2
-Terres
Land
1478 m2
-Terres
2025-01-13
249 000 
1 858  /m²(134 m²)
Sale
Houses
House
4 rooms
134 m2
Land
286 m2
-Sols
2025-01-13
51 000 
Sale
Land
472 m2
-Jardins
2024-12-30
290 000 
2 417  /m²(120 m²)
Sale
Houses
House
5 rooms
120 m2
Land
1009 m2
-Jardins
Land
702 m2
-Sols
2024-12-30
392 000 
2 240  /m²(175 m²)
Sale
Houses
House
7 rooms
175 m2
1 outbuilding
Land
778 m2
-Prés
Land
48 m2
-Sols
Land
987 m2
-Jardins
2024-11-14
152 000 
2 171  /m²(70 m²)
Sale
Houses
House
3 rooms
70 m2
Land
94 m2
-Sols
Land
236 m2
-Sols
2024-10-31
153 000 
3 825  /m²(40 m²)
Sale
Houses
House
3 rooms
40 m2
Land
220 m2
-Sols
2024-10-30
135 337 
1 829  /m²(74 m²)
Sale
Houses
House
4 rooms
74 m2
Land
1093 m2
-Sols
2024-10-02
8 400 
Sale
Land
5230 m2
-Terres
393 transactions listed in the municipality

Oise (60)

Most expensive cities

City
name
Descending orderHouses
house
Price per m²
4 500 
4 036 
3 894 
3 828 
3 625 
3 603 
3 564 
City
name
Descending orderApartments
apt.
Price per m²
4 598 
4 036 
4 027 
3 876 
3 732 
3 704 
3 612 
3 500 
3 462 

Least expensive cities

City
name
Ascending orderHouses
house
Price per m²
330 
878 
920 
1 019 
1 031 
1 042 
1 049 
City
name
Ascending orderApartments
apt.
Price per m²
12 
184 
294 
333 
379 
500 
574