emooki
HomePrice mapTransactions
🇬🇧 English🇫🇷 Français🇩🇪 Deutsch🇪🇸 Español🇮🇹 Italiano

Real estate price map


Real estate price map in the municipality of Quincampoix-Fleuzy, choose a section to see transactions by parcel.

Oise (60)

Quincampoix-Fleuzy - Real estate price m²

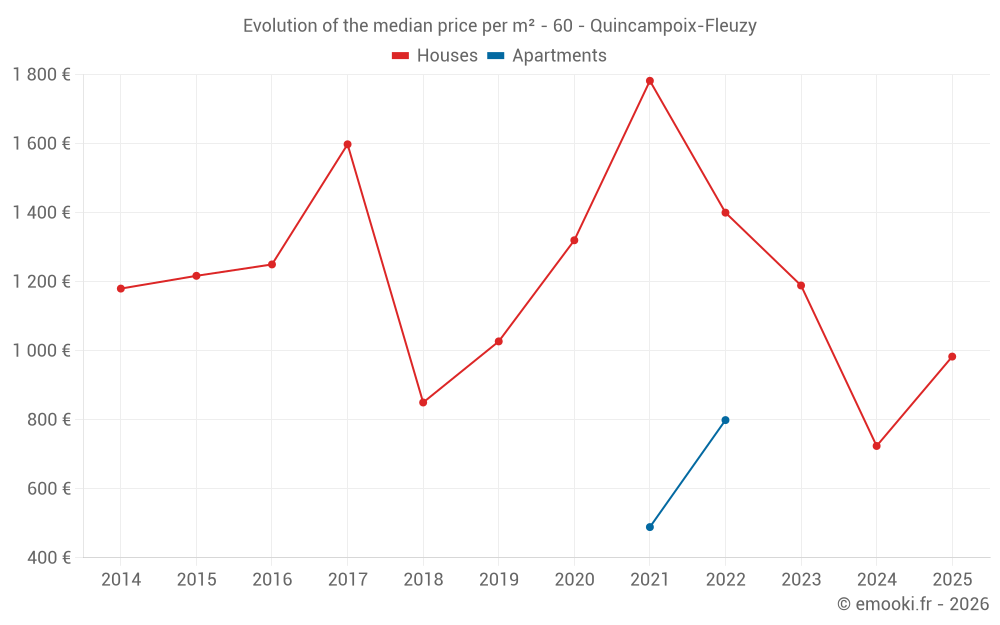
Median price of real estate
in the municipality of Quincampoix-Fleuzy

HousesHouses
1 189  /m²
1-23-45-67-89-10
Reliability 6/10
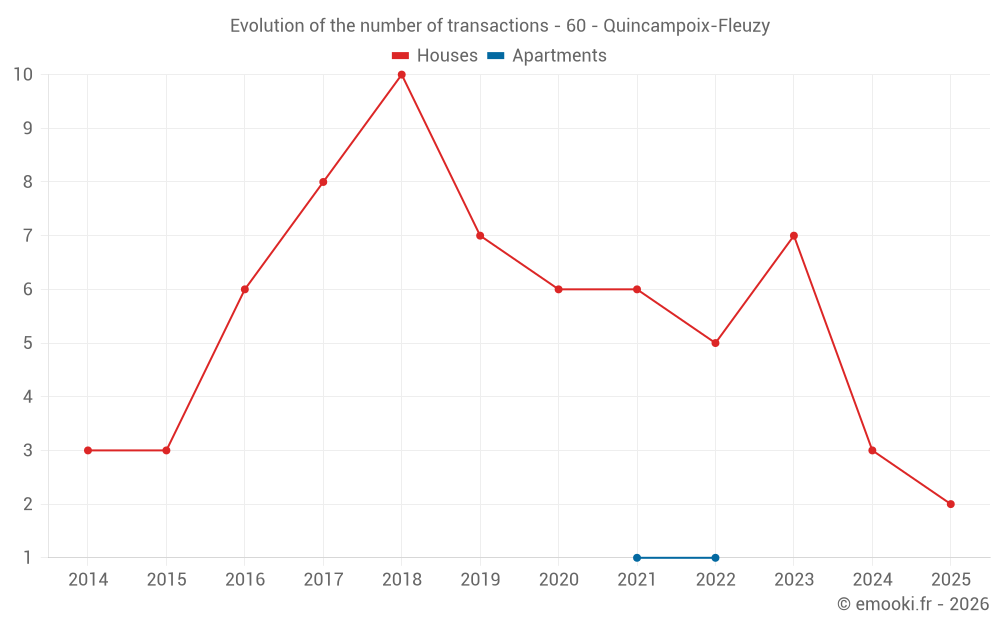
Median price on the 17 transactions of the last 36 months.
from 678 to
1 618  /m²
60% of transactions from the 2nd to the 8th deciles.
ApartmentsApartments
644  /m²
1-23-45-67-89-10
Reliability 1/10
Median price on the 2 transactions of the last 120 months.
DwellingsDwellings
1 182  /m²
1-23-45-67-89-10
Reliability 6/10
Median price on the 18 transactions of the last 36 months.
from 690 to
1 608  /m²
60% of transactions from the 2nd to the 8th deciles.

Yearly evolution

Evolution of the median price per m²

Evolution of the median price per m² - 60 - Quincampoix-Fleuzy

Evolution of the number of transactions

Warning, last year incomplete. Projections made based on the proportions between semesters of the previous year at the departmental/national level and by type of property.

Evolution of the number of transactions - 60 - Quincampoix-Fleuzy

Yearly data

Descending order
Year
Houses
house
transactions
Houses
house
Price per m²
Apartments
apt.
transactions
Apartments
apt.
Price per m²
2025
2
983 
0
--- 
2024
3
724 
0
--- 
2023
7
1 189 
0
--- 
2022
5
1 400 
1
799 
2021
6
1 782 
1
489 
2020
6
1 320 
0
--- 
2019
7
1 027 
0
--- 
2018
10
850 
0
--- 
2017
8
1 598 
0
--- 
2016
6
1 250 
0
--- 
2015
3
1 217 
0
--- 
2014
3
1 180 
0
--- 

Analysis

Structure of prices per m²

Values of price percentiles per m² over the periods used for the estimated price of each type of property.

Structure of transaction amounts

Values of transaction amounts percentiles over the periods used for the estimated price of each type of property.

Transaction amounts and prices per m² by percentile

Ascending order
Percentile
Houses
house
Price per m²
Houses
house
Transaction amount
Apartments
apt.
Price per m²
Apartments
apt.
Transaction amount
10th percentile
655 
39 200 
520 
47 850 
20th percentile
678 
53 600 
551 
50 700 
30th percentile
865 
56 800 
582 
53 550 
40th percentile
1 129 
62 400 
613 
56 400 
50th percentile
1 189 
70 000 
644 
59 250 
60th percentile
1 417 
78 600 
675 
62 100 
70th percentile
1 471 
132 K
706 
64 950 
80th percentile
1 618 
162 K
737 
67 800 
90th percentile
1 787 
175 K
768 
70 650 

National and departmental comparison

Evolution of the median price per m² of houses

Evolution of the median price per m² of apartments

Quarterly evolution

Evolution of the median price per m²

Evolution of the number of transactions

Quarterly data

Descending order
Quarter
Houses
house
transactions
Houses
house
Price per m²
Apartments
apt.
transactions
Apartments
apt.
Price per m²
2025 Q1
2
983 
0
--- 
2024 Q4
1
667 
0
--- 
2024 Q2
1
724 
0
--- 
2024 Q1
1
1 628 
0
--- 
2023 Q4
2
1 172 
0
--- 
2023 Q3
2
1 670 
0
--- 
2023 Q2
2
1 252 
0
--- 
2023 Q1
1
1 189 
0
--- 
2022 Q4
2
1 024 
0
--- 
2022 Q3
3
1 429 
1
799 
2021 Q4
2
1 782 
0
--- 
2021 Q2
3
1 979 
0
--- 
2021 Q1
1
477 
1
489 
2020 Q4
2
1 412 
0
--- 
2020 Q3
1
1 419 
0
--- 
2020 Q2
2
1 166 
0
--- 
2020 Q1
1
2 000 
0
--- 
2019 Q4
2
1 317 
0
--- 
2019 Q3
3
976 
0
--- 
2019 Q2
1
1 006 
0
--- 
2019 Q1
1
1 167 
0
--- 
2018 Q4
4
795 
0
--- 
2018 Q3
1
899 
0
--- 
2018 Q2
1
1 111 
0
--- 
2018 Q1
4
917 
0
--- 
2017 Q4
1
1 892 
0
--- 
2017 Q3
4
1 712 
0
--- 
2017 Q2
2
1 102 
0
--- 
2017 Q1
1
1 623 
0
--- 
2016 Q4
2
991 
0
--- 
2016 Q3
3
1 250 
0
--- 
2016 Q1
1
1 356 
0
--- 
2015 Q2
1
1 563 
0
--- 
2015 Q1
2
1 067 
0
--- 
2014 Q4
2
1 874 
0
--- 
2014 Q3
1
927 
0
--- 

Overview of the latest real estate transactions

The following list is an anonymized overview of the latest transactions. For more details and to find all transactions, please use the map to view transactions by plot or the transaction search page for a search by criteria.

2025-06-11
22 200 
Sale
Land
17070 m2
-Taillis sous futaie
2025-03-14
2 000 
Sale
Land
3410 m2
-Herbages
2025-03-05
82 000 
1 577  /m²(52 m²)
Sale
Houses
House
3 rooms
52 m2
Land
1270 m2
-Sols
2025-02-19
35 000 
389  /m²(90 m²)
Sale
Houses
House
5 rooms
90 m2
2 outbuildings
Land
551 m2
-Sols
Land
904 m2
-Jardins
Land
31 m2
-Sols
2024-12-28
66 000 
667  /m²(99 m²)
Sale
Houses
House
5 rooms
99 m2
1 outbuilding
Land
433 m2
-Sols
2024-09-09
35 000 
Sale
Land
719 m2
-Jardins
Land
2326 m2
-Sols
Land
231 m2
-Sols
2024-04-12
42 000 
724  /m²(58 m²)
Sale
Houses
House
4 rooms
58 m2
2 outbuildings
Land
255 m2
-Sols
Land
31 m2
-Sols
Land
302 m2
-Sols
2024-03-29
90 000 
46  /m²(1938 m²)
Sale
Commercial property
1938 m2
Land
1952 m2
-Sols
Land
1412 m2
-Sols
2024-03-05
175 850 
1 628  /m²(108 m²)
Sale
Houses
House
5 rooms
108 m2
Land
1200 m2
-Sols
2023-12-13
54 000 
900  /m²(60 m²)
Sale
Houses
House
4 rooms
60 m2
Land
552 m2
-Sols
Land
560 m2
-Herbages
2023-10-24
130 000 
1 444  /m²(90 m²)
Sale
Houses
House
4 rooms
90 m2
Land
397 m2
-Sols
Land
514 m2
-Herbages
2023-09-07
213 000 
2 242  /m²(95 m²)
Sale
Houses
House
2 rooms
95 m2
1 outbuilding
Land
717 m2
-Sols
2023-07-20
73 500 
1 097  /m²(67 m²)
Sale
Houses
House
3 rooms
67 m2
1 outbuilding
Land
898 m2
-Sols
2023-06-17
57 500 
661  /m²(87 m²)
Sale
Houses
House
4 rooms
87 m2
Land
500 m2
-Sols
Land
570 m2
-Jardins
2023-04-01
175 000 
1 842  /m²(95 m²)
Sale
Houses
House
5 rooms
95 m2
Land
708 m2
-Sols
2023-03-03
53 500 
1 189  /m²(45 m²)
Sale
Houses
House
2 rooms
45 m2
1 outbuilding
Land
500 m2
-Sols
2022-10-24
23 300 
647  /m²(36 m²)
Sale
Houses
House
2 rooms
36 m2
Land
1100 m2
-Sols
2022-10-01
168 000 
1 400  /m²(120 m²)
Sale
Houses
House
5 rooms
120 m2
Land
697 m2
-Jardins
Land
500 m2
-Sols
2022-08-09
60 000 
1 429  /m²(42 m²)
Sale
Houses
House
3 rooms
42 m2
1 outbuilding
Land
276 m2
-Sols
2022-07-13
73 500 
799  /m²(92 m²)
Sale
Apartments
Apartment
1 room
31 m2
3 outbuildings
Apartments
Apartment
3 rooms
61 m2
3 outbuildings
Land
4 m2
-Sols
102 transactions listed in the municipality

Oise (60)

Most expensive cities

City
name
Descending orderHouses
house
Price per m²
4 500 
4 036 
3 894 
3 828 
3 625 
3 603 
3 564 
City
name
Descending orderApartments
apt.
Price per m²
4 598 
4 036 
4 027 
3 876 
3 732 
3 704 
3 612 
3 500 
3 462 

Least expensive cities

City
name
Ascending orderHouses
house
Price per m²
330 
878 
920 
1 019 
1 031 
1 042 
1 049 
City
name
Ascending orderApartments
apt.
Price per m²
12 
184 
294 
333 
379 
500 
574