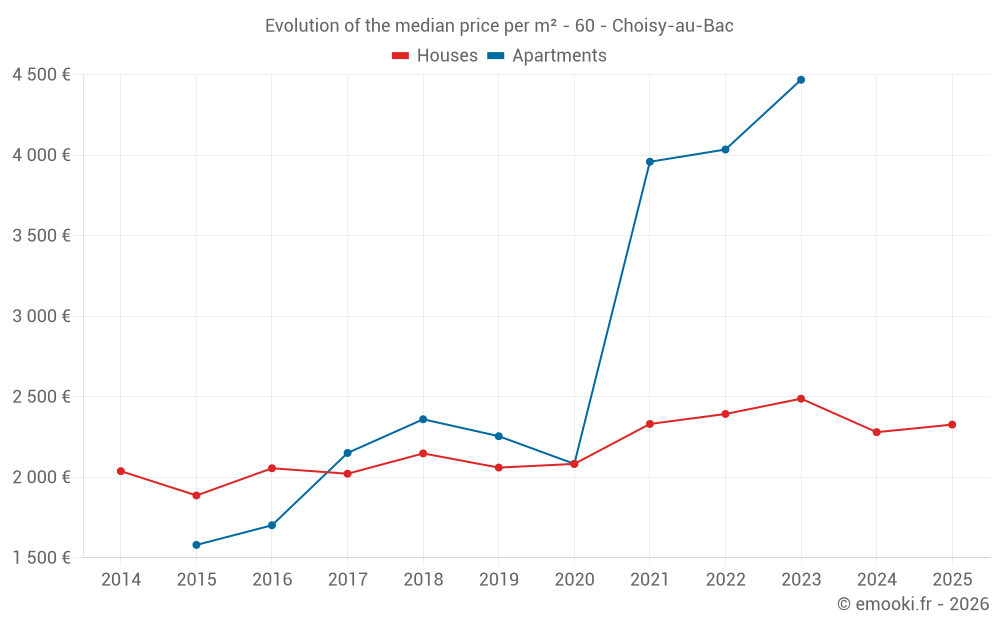
Median price of real estate
in the municipality of Choisy-au-Bac
Houses
2 338 € /m²
Reliability 8/10
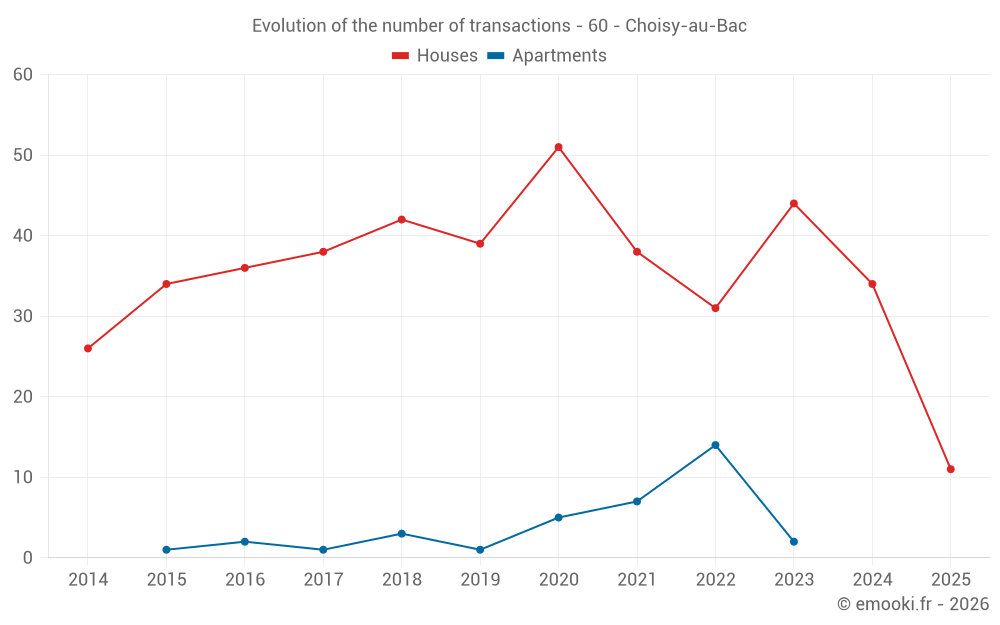
Median price on the 25 transactions of the last 12 months.
from 1 729 to
2 628 € /m²
2 628 € /m²
60% of transactions from the 2nd to the 8th deciles.
Apartments
4 036 € /m²
Reliability 5/10
Median price on the 20 transactions of the last 48 months.
from 3 985 to
4 451 € /m²
4 451 € /m²
60% of transactions from the 2nd to the 8th deciles.
Dwellings
2 338 € /m²
Reliability 8/10
Median price on the 25 transactions of the last 12 months.
from 1 729 to
2 628 € /m²
2 628 € /m²
60% of transactions from the 2nd to the 8th deciles.