emooki
HomePrice mapTransactions
🇬🇧 English🇫🇷 Français🇩🇪 Deutsch🇪🇸 Español🇮🇹 Italiano

Real estate price map


Real estate price map in the municipality of Saint-Germer-de-Fly, choose a section to see transactions by parcel.

Oise (60)

Saint-Germer-de-Fly - Real estate price m²

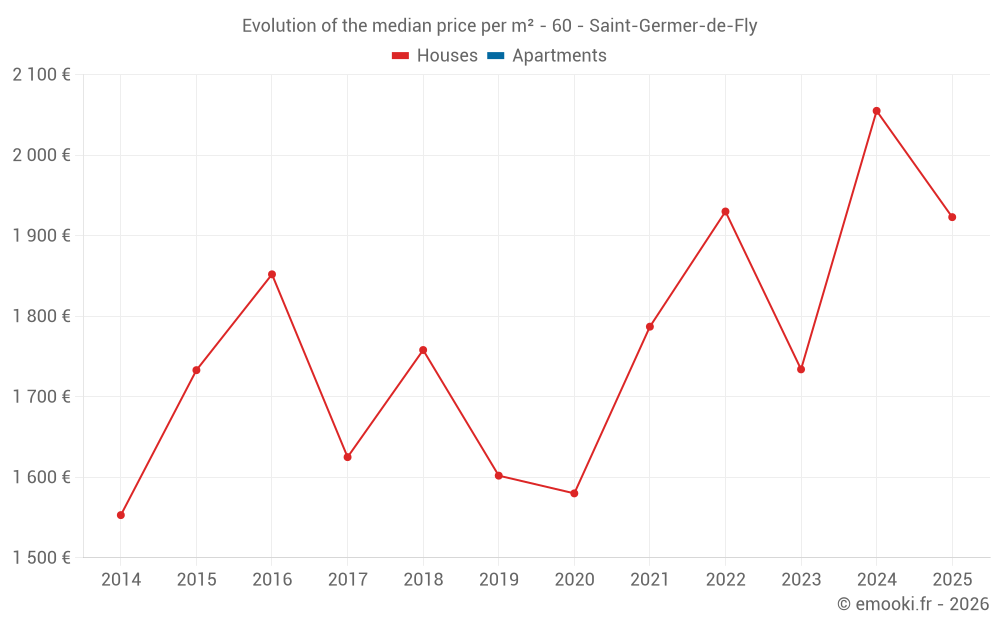
Median price of real estate
in the municipality of Saint-Germer-de-Fly

HousesHouses
1 765  /m²
1-23-45-67-89-10
Reliability 7/10
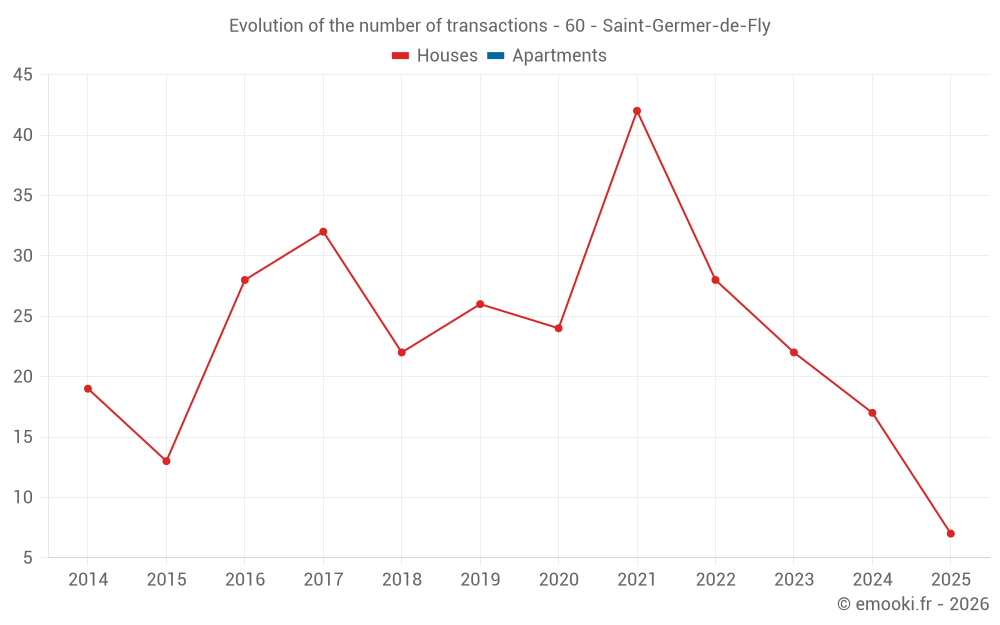
Median price on the 36 transactions of the last 24 months.
from 1 425 to
2 301  /m²
60% of transactions from the 2nd to the 8th deciles.
HousesEvolution of the price per m² of houses since...
1 year
-6.4%
2 years
+11%
3 years
-0.4%
4 years
+7.6%
5 years
+22%
6 years
+20%
7 years
+9.4%
8 years
+18%
9 years
+3.8%
10 years
+11%
11 years
+24%
The price per m² of houses has decreased by 6.4% since 1 year, but it has increased by 24% in 11 years.

Yearly evolution

Evolution of the median price per m²

Evolution of the median price per m² - 60 - Saint-Germer-de-Fly

Evolution of the number of transactions

Warning, last year incomplete. Projections made based on the proportions between semesters of the previous year at the departmental/national level and by type of property.

Evolution of the number of transactions - 60 - Saint-Germer-de-Fly

Yearly data

Descending order
Year
Houses
house
transactions
Houses
house
Price per m²
Apartments
apt.
transactions
Apartments
apt.
Price per m²
2025
7
1 923 
0
--- 
2024
17
2 055 
0
--- 
2023
22
1 734 
0
--- 
2022
28
1 930 
0
--- 
2021
42
1 787 
0
--- 
2020
24
1 580 
0
--- 
2019
26
1 602 
0
--- 
2018
22
1 758 
0
--- 
2017
32
1 625 
0
--- 
2016
28
1 852 
0
--- 
2015
13
1 733 
0
--- 
2014
19
1 553 
0
--- 

Analysis

Structure of prices per m²

Values of price percentiles per m² over the periods used for the estimated price of each type of property.

Structure of transaction amounts

Values of transaction amounts percentiles over the periods used for the estimated price of each type of property.

Transaction amounts and prices per m² by percentile

Ascending order
Percentile
Houses
house
Price per m²
Houses
house
Transaction amount
Apartments
apt.
Price per m²
Apartments
apt.
Transaction amount
10th percentile
1 069 
62 500 
--- 
--- 
20th percentile
1 425 
95 000 
--- 
--- 
30th percentile
1 532 
125 K
--- 
--- 
40th percentile
1 644 
149 K
--- 
--- 
50th percentile
1 765 
152 K
--- 
--- 
60th percentile
2 055 
187 K
--- 
--- 
70th percentile
2 170 
199 K
--- 
--- 
80th percentile
2 301 
225 K
--- 
--- 
90th percentile
3 006 
248 K
--- 
--- 

National and departmental comparison

Evolution of the median price per m² of houses

Evolution of the median price per m² of apartments

Quarterly evolution

Evolution of the median price per m²

Evolution of the number of transactions

Quarterly data

Descending order
Quarter
Houses
house
transactions
Houses
house
Price per m²
Apartments
apt.
transactions
Apartments
apt.
Price per m²
2025 Q2
4
1 755 
0
--- 
2025 Q1
3
2 014 
0
--- 
2024 Q4
4
1 620 
0
--- 
2024 Q3
2
2 162 
0
--- 
2024 Q2
8
1 796 
0
--- 
2024 Q1
3
1 630 
0
--- 
2023 Q4
5
1 741 
0
--- 
2023 Q3
7
1 727 
0
--- 
2023 Q2
7
1 520 
0
--- 
2023 Q1
3
2 180 
0
--- 
2022 Q4
10
1 856 
0
--- 
2022 Q3
9
2 443 
0
--- 
2022 Q2
4
2 011 
0
--- 
2022 Q1
5
1 778 
0
--- 
2021 Q4
13
2 284 
0
--- 
2021 Q3
13
1 681 
0
--- 
2021 Q2
9
1 583 
0
--- 
2021 Q1
7
1 583 
0
--- 
2020 Q4
8
1 453 
0
--- 
2020 Q3
3
1 763 
0
--- 
2020 Q2
8
1 625 
0
--- 
2020 Q1
5
1 528 
0
--- 
2019 Q4
10
1 629 
0
--- 
2019 Q3
7
1 667 
0
--- 
2019 Q2
3
1 240 
0
--- 
2019 Q1
6
1 468 
0
--- 
2018 Q4
6
1 404 
0
--- 
2018 Q3
1
2 206 
0
--- 
2018 Q2
8
1 575 
0
--- 
2018 Q1
7
1 769 
0
--- 
2017 Q4
6
2 000 
0
--- 
2017 Q3
7
1 890 
0
--- 
2017 Q2
11
1 481 
0
--- 
2017 Q1
8
1 552 
0
--- 
2016 Q4
12
1 624 
0
--- 
2016 Q3
5
1 971 
0
--- 
2016 Q2
7
2 444 
0
--- 
2016 Q1
4
2 035 
0
--- 
2015 Q4
6
1 776 
0
--- 
2015 Q3
2
1 188 
0
--- 
2015 Q2
3
1 346 
0
--- 
2015 Q1
2
2 110 
0
--- 
2014 Q4
3
1 461 
0
--- 
2014 Q3
8
1 483 
0
--- 
2014 Q2
1
2 027 
0
--- 
2014 Q1
7
1 972 
0
--- 

Overview of the latest real estate transactions

The following list is an anonymized overview of the latest transactions. For more details and to find all transactions, please use the map to view transactions by plot or the transaction search page for a search by criteria.

2025-06-13
150 000 
1 923  /m²(78 m²)
Sale
Houses
House
3 rooms
78 m2
1 outbuilding
Land
1015 m2
-Sols
2025-05-26
10 000 
Sale
Land
7540 m2
-Herbages
2025-05-13
153 000 
2 068  /m²(74 m²)
Sale
Houses
House
4 rooms
74 m2
Land
595 m2
-Terres
2025-04-29
146 000 
1 587  /m²(92 m²)
Sale
Houses
House
4 rooms
92 m2
Land
1055 m2
-Sols
2025-04-17
52 000 
536  /m²(97 m²)
Sale
Houses
House
3 rooms
97 m2
Land
1310 m2
-Jardins
Land
705 m2
-Sols
Land
662 m2
-Jardins
2025-03-20
149 000 
2 014  /m²(74 m²)
Sale
Houses
House
4 rooms
74 m2
1 outbuilding
Land
1000 m2
-Sols
Land
210 m2
-Jardins
2025-03-19
3 000 
Sale
Land
460 m2
-Terres
2025-02-25
83 000 
1 482  /m²(56 m²)
Sale
Houses
House
3 rooms
56 m2
Land
80 m2
-Sols
2025-01-24
196 000 
1 867  /m²(105 m²)
2 306  /m²(85 m²)
Sale
Houses
House
3 rooms
85 m2
Commercial property
20 m2
2025-01-16
110 000 
1 310  /m²(84 m²)
Sale
Commercial property
84 m2
Land
745 m2
-Sols
2025-01-06
180 000 
2 432  /m²(74 m²)
Sale
Houses
House
3 rooms
74 m2
Land
791 m2
-Sols
2024-12-26
13 500 
Sale
Land
7990 m2
-Terres
Land
8896 m2
-Terres
2024-12-20
168 000 
2 301  /m²(73 m²)
Sale
Houses
House
3 rooms
73 m2
Land
610 m2
-Sols
2024-12-19
60 000 
938  /m²(64 m²)
Sale
Houses
House
3 rooms
64 m2
2 outbuildings
Land
875 m2
-Sols
2024-12-07
130 000 
Sale
Land
21937 m2
-Terres
Land
8760 m2
-Terres
Land
5577 m2
-Terres
Land
5578 m2
-Terres
Land
5145 m2
-Terres
Land
8710 m2
-Terres
Land
82050 m2
-Terres
Land
690 m2
-Terres
Land
1990 m2
-Terres
Land
21104 m2
-Terres
2024-11-28
203 800 
3 235  /m²(63 m²)
Sale
Houses
House
5 rooms
63 m2
2 outbuildings
Land
1000 m2
-Sols
2024-11-28
12 196 
407  /m²(30 m²)
Sale
Houses
House
2 rooms
30 m2
Land
1276 m2
-Terrains à bâtir
Land
1000 m2
-Sols
2024-10-14
76 010 
Sale
Land
519 m2
-Jardins
Land
1881 m2
-Herbages
Land
1107 m2
-Sols
Land
500 m2
-Sols
2024-09-24
9 000 
Sale
Land
15368 m2
-Herbages
2024-09-23
225 000 
2 083  /m²(108 m²)
Sale
Houses
House
4 rooms
108 m2
Land
700 m2
-Jardins
Land
500 m2
-Sols
413 transactions listed in the municipality

Oise (60)

Most expensive cities

City
name
Descending orderHouses
house
Price per m²
4 500 
4 036 
3 894 
3 828 
3 625 
3 603 
3 564 
City
name
Descending orderApartments
apt.
Price per m²
4 598 
4 036 
4 027 
3 876 
3 732 
3 704 
3 612 
3 500 
3 462 

Least expensive cities

City
name
Ascending orderHouses
house
Price per m²
330 
878 
920 
1 019 
1 031 
1 042 
1 049 
City
name
Ascending orderApartments
apt.
Price per m²
12 
184 
294 
333 
379 
500 
574