emooki
HomePrice mapTransactions
🇬🇧 English🇫🇷 Français🇩🇪 Deutsch🇪🇸 Español🇮🇹 Italiano

Real estate price map


Real estate price map in the municipality of Longueil-Annel, choose a section to see transactions by parcel.

Oise (60)

Longueil-Annel - Real estate price m²

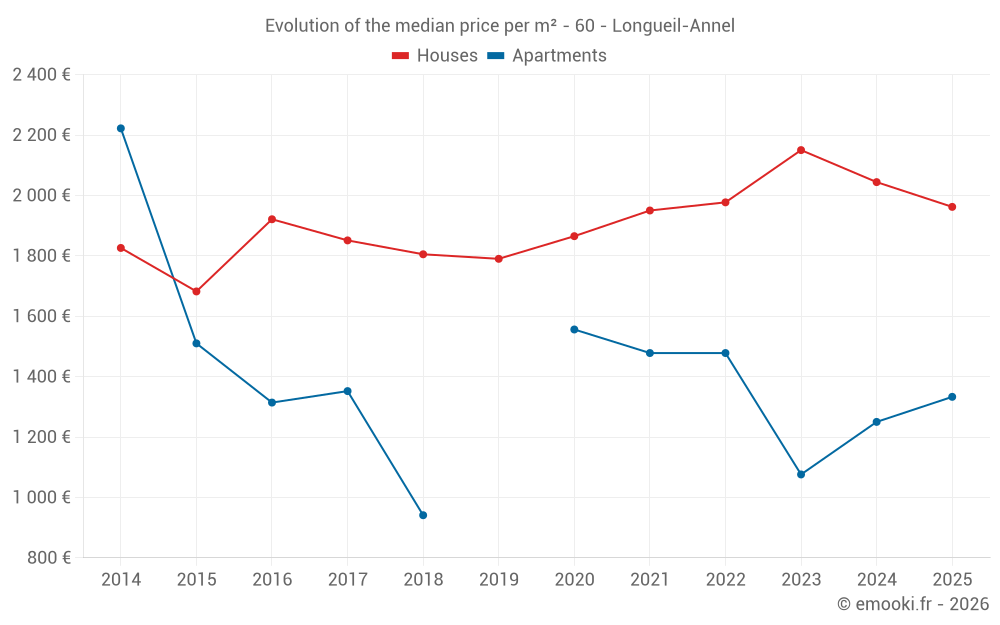
Median price of real estate
in the municipality of Longueil-Annel

HousesHouses
1 993  /m²
1-23-45-67-89-10
Reliability 8/10
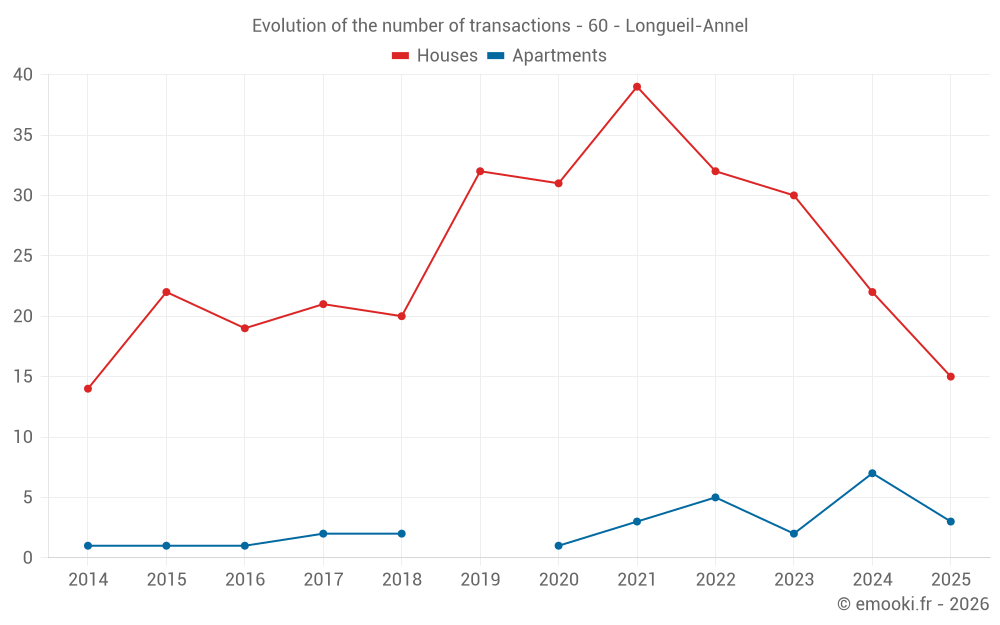
Median price on the 29 transactions of the last 12 months.
from 1 643 to
2 262  /m²
60% of transactions from the 2nd to the 8th deciles.
ApartmentsApartments
1 295  /m²
1-23-45-67-89-10
Reliability 6/10
Median price on the 16 transactions of the last 36 months.
from 814 to
1 456  /m²
60% of transactions from the 2nd to the 8th deciles.
DwellingsDwellings
1 836  /m²
1-23-45-67-89-10
Reliability 9/10
Median price on the 18 transactions of the last 6 months.
from 1 374 to
2 176  /m²
60% of transactions from the 2nd to the 8th deciles.
HousesEvolution of the price per m² of houses since...
1 year
-4%
2 years
-8.7%
3 years
-0.8%
4 years
+0.6%
5 years
+5.2%
6 years
+10%
7 years
+8.7%
8 years
+6%
9 years
+2.1%
10 years
+17%
11 years
+7.4%
The price per m² of houses has decreased by 8.7% since 2 years, but it has increased by 17% in 10 years.

Yearly evolution

Evolution of the median price per m²

Evolution of the median price per m² - 60 - Longueil-Annel

Evolution of the number of transactions

Warning, last year incomplete. Projections made based on the proportions between semesters of the previous year at the departmental/national level and by type of property.

Evolution of the number of transactions - 60 - Longueil-Annel

Yearly data

Descending order
Year
Houses
house
transactions
Houses
house
Price per m²
Apartments
apt.
transactions
Apartments
apt.
Price per m²
2025
15
1 962 
3
1 333 
2024
22
2 044 
7
1 250 
2023
30
2 150 
2
1 076 
2022
32
1 977 
5
1 478 
2021
39
1 950 
3
1 478 
2020
31
1 865 
1
1 556 
2019
32
1 790 
0
--- 
2018
20
1 805 
2
941 
2017
21
1 851 
2
1 352 
2016
19
1 921 
1
1 314 
2015
22
1 682 
1
1 510 
2014
14
1 826 
1
2 222 

Analysis

Structure of prices per m²

Values of price percentiles per m² over the periods used for the estimated price of each type of property.

Structure of transaction amounts

Values of transaction amounts percentiles over the periods used for the estimated price of each type of property.

Transaction amounts and prices per m² by percentile

Ascending order
Percentile
Houses
house
Price per m²
Houses
house
Transaction amount
Apartments
apt.
Price per m²
Apartments
apt.
Transaction amount
10th percentile
1 427 
100 K
654 
59 500 
20th percentile
1 643 
111 K
814 
90 000 
30th percentile
1 774 
126 K
1 240 
90 000 
40th percentile
1 874 
147 K
1 252 
95 000 
50th percentile
1 993 
168 K
1 295 
99 000 
60th percentile
2 079 
190 K
1 333 
100 K
70th percentile
2 125 
204 K
1 355 
118 K
80th percentile
2 262 
219 K
1 456 
154 K
90th percentile
2 915 
280 K
1 506 
220 K

National and departmental comparison

Evolution of the median price per m² of houses

Evolution of the median price per m² of apartments

Quarterly evolution

Evolution of the median price per m²

Evolution of the number of transactions

Quarterly data

Descending order
Quarter
Houses
house
transactions
Houses
house
Price per m²
Apartments
apt.
transactions
Apartments
apt.
Price per m²
2025 Q2
8
1 854 
3
1 333 
2025 Q1
7
2 117 
0
--- 
2024 Q4
7
1 888 
5
1 250 
2024 Q3
7
2 077 
0
--- 
2024 Q2
4
2 151 
1
814 
2024 Q1
4
1 654 
1
1 583 
2023 Q4
8
2 104 
1
1 456 
2023 Q3
6
2 404 
1
697 
2023 Q2
10
2 112 
0
--- 
2023 Q1
6
1 998 
0
--- 
2022 Q4
1
1 733 
2
1 298 
2022 Q3
14
2 290 
2
1 506 
2022 Q2
12
1 913 
1
1 724 
2022 Q1
5
1 968 
0
--- 
2021 Q4
7
2 000 
1
1 478 
2021 Q3
11
2 291 
0
--- 
2021 Q2
9
1 685 
2
987 
2021 Q1
12
1 838 
0
--- 
2020 Q4
15
1 886 
0
--- 
2020 Q3
9
1 804 
1
1 556 
2020 Q2
2
1 162 
0
--- 
2020 Q1
5
1 625 
0
--- 
2019 Q4
8
1 670 
0
--- 
2019 Q3
10
1 724 
0
--- 
2019 Q2
4
2 092 
0
--- 
2019 Q1
10
1 824 
0
--- 
2018 Q4
3
1 868 
1
632 
2018 Q3
9
1 750 
0
--- 
2018 Q2
3
1 841 
0
--- 
2018 Q1
5
2 277 
1
1 250 
2017 Q4
4
2 484 
2
1 352 
2017 Q3
8
1 903 
0
--- 
2017 Q2
5
1 557 
0
--- 
2017 Q1
4
1 771 
0
--- 
2016 Q4
4
1 864 
0
--- 
2016 Q3
9
1 862 
1
1 314 
2016 Q2
4
2 368 
0
--- 
2016 Q1
2
1 832 
0
--- 
2015 Q4
6
1 866 
0
--- 
2015 Q3
10
1 624 
0
--- 
2015 Q2
4
1 721 
1
1 510 
2015 Q1
2
1 870 
0
--- 
2014 Q4
5
1 969 
0
--- 
2014 Q3
5
1 818 
0
--- 
2014 Q2
1
1 746 
1
2 222 
2014 Q1
3
2 183 
0
--- 

Overview of the latest real estate transactions

The following list is an anonymized overview of the latest transactions. For more details and to find all transactions, please use the map to view transactions by plot or the transaction search page for a search by criteria.

2025-06-20
110 000 
1 746  /m²(63 m²)
Sale
Houses
House
4 rooms
63 m2
Land
525 m2
-Jardins
Land
500 m2
-Sols
2025-06-17
154 000 
1 252  /m²(123 m²)
Sale
Apartments
Apartment
4 rooms
88 m2
Apartments
Apartment
1 room
35 m2
Land
593 m2
-Sols
2025-06-17
5 000 
Sale
Land
66 m2
-Sols
2025-06-12
121 000 
1 344  /m²(90 m²)
Sale
Houses
House
4 rooms
90 m2
Land
184 m2
-Sols
Land
231 m2
-Sols
Land
108 m2
-Sols
Land
106 m2
-Jardins
Land
61 m2
-Jardins
Land
141 m2
-Sols
2025-06-10
25 000 
Sale
Land
1532 m2
-Prés
Land
222 m2
-Jardins
2025-06-06
36 000 
Sale
Land
310 m2
-Jardins
2025-05-23
144 000 
1 636  /m²(88 m²)
Sale
Houses
House
5 rooms
88 m2
Land
342 m2
-Sols
2025-05-23
160 000 
1 333  /m²(120 m²)
Sale
Apartments
Apartment
4 rooms
60 m2
Land
571 m2
-Sols
Apartments
Apartment
4 rooms
60 m2
Land
577 m2
-Sols
2025-05-06
100 000 
1 667  /m²(60 m²)
Sale
Houses
House
3 rooms
60 m2
Land
208 m2
-Sols
2025-05-02
156 990 
1 962  /m²(80 m²)
Sale
Houses
House
4 rooms
80 m2
Land
932 m2
-Sols
Land
405 m2
-Sols
Land
1072 m2
-Jardins
Land
127 m2
-Jardins
Land
247 m2
-Jardins
Land
128 m2
-Jardins
2025-04-30
285 000 
1 993  /m²(143 m²)
Sale
Houses
House
7 rooms
143 m2
Land
541 m2
-Sols
2025-04-09
90 000 
1 343  /m²(67 m²)
Sale
Apartments
Apartment
3 rooms
67 m2
2 outbuildings
2025-04-08
279 000 
2 197  /m²(127 m²)
Sale
Houses
House
5 rooms
127 m2
Land
464 m2
-Sols
Land
261 m2
-Sols
Land
306 m2
-Sols
2025-04-04
194 000 
2 694  /m²(72 m²)
Sale
Houses
House
5 rooms
72 m2
Land
333 m2
-Sols
Land
577 m2
-Jardins
2025-04-04
1 
Sale
Land
276 m2
-Taillis sous futaie
2025-03-21
20 000 
Sale
Land
2880 m2
-Sols
2025-03-14
70 000 
Sale
1 outbuilding
Land
785 m2
-Sols
1 outbuilding
Land
162 m2
-Sols
2025-03-14
45 000 
Sale
Land
419 m2
-Terrains à bâtir
Land
419 m2
-Terrains à bâtir
2025-03-06
110 000 
2 444  /m²(45 m²)
Sale
Houses
House
2 rooms
45 m2
1 outbuilding
Land
50 m2
-Sols
Land
11 m2
-Sols
Land
24 m2
-Sols
2025-03-06
132 000 
Sale
Land
526 m2
-Sols
472 transactions listed in the municipality

Oise (60)

Most expensive cities

City
name
Descending orderHouses
house
Price per m²
4 500 
4 036 
3 894 
3 828 
3 625 
3 603 
3 564 
City
name
Descending orderApartments
apt.
Price per m²
4 598 
4 036 
4 027 
3 876 
3 732 
3 704 
3 612 
3 500 
3 462 

Least expensive cities

City
name
Ascending orderHouses
house
Price per m²
330 
878 
920 
1 019 
1 031 
1 042 
1 049 
City
name
Ascending orderApartments
apt.
Price per m²
12 
184 
294 
333 
379 
500 
574