emooki
HomePrice mapTransactions
🇬🇧 English🇫🇷 Français🇩🇪 Deutsch🇪🇸 Español🇮🇹 Italiano

Real estate price map


Real estate price map in the municipality of Petite-Forêt, choose a section to see transactions by parcel.

Nord (59)
Petite-Forêt

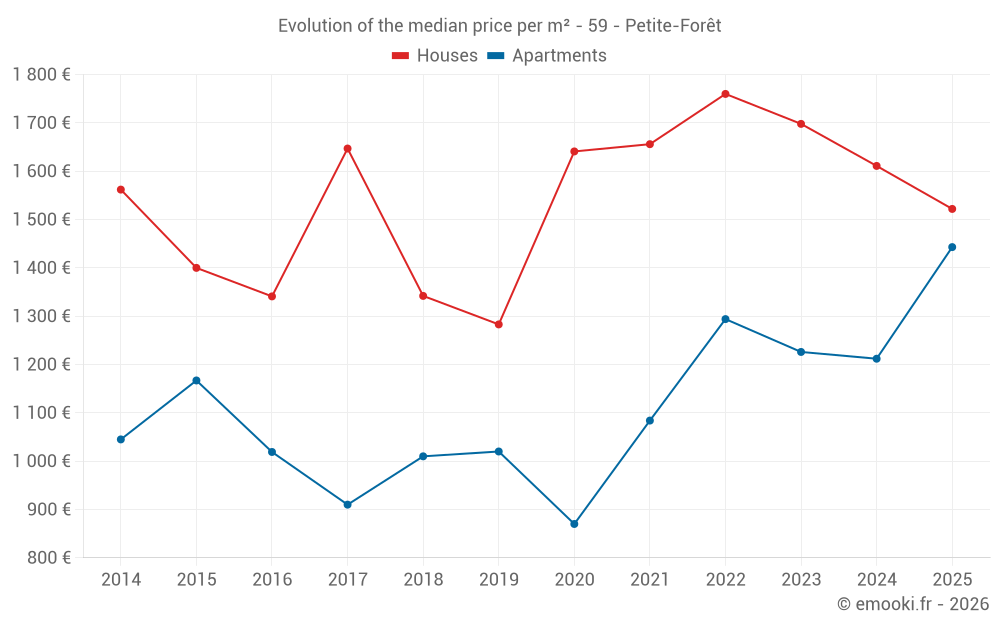
Median price of real estate
in the municipality of Petite-Forêt

HousesHouses
1 522  /m²
1-23-45-67-89-10
Reliability 9/10
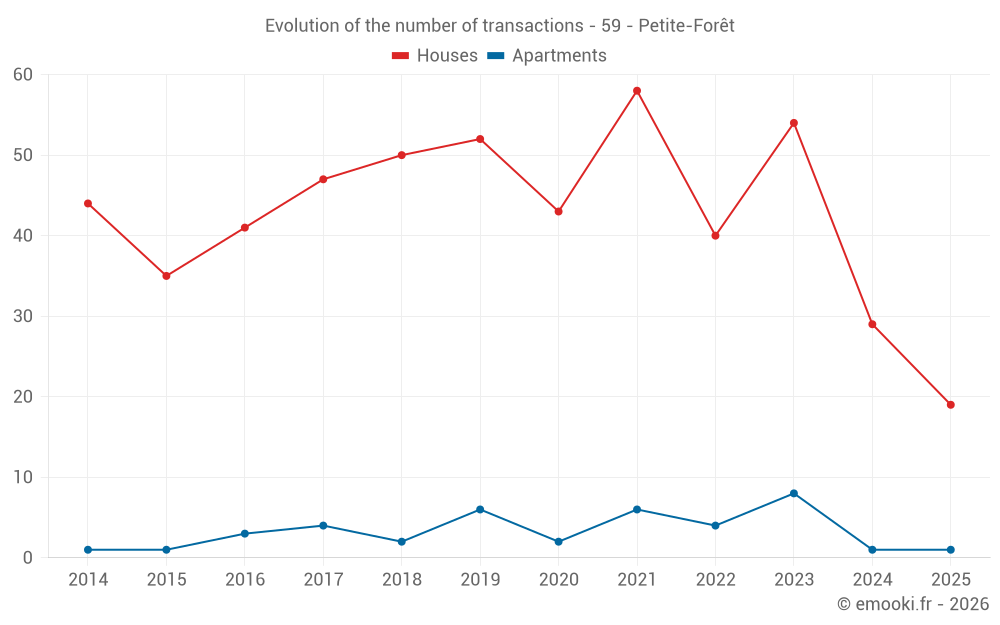
Median price on the 19 transactions of the last 6 months.
from 926 to
2 129  /m²
60% of transactions from the 2nd to the 8th deciles.
ApartmentsApartments
1 226  /m²
1-23-45-67-89-10
Reliability 6/10
Median price on the 12 transactions of the last 36 months.
from 1 180 to
1 334  /m²
60% of transactions from the 2nd to the 8th deciles.
DwellingsDwellings
1 482  /m²
1-23-45-67-89-10
Reliability 9/10
Median price on the 20 transactions of the last 6 months.
from 932 to
2 128  /m²
60% of transactions from the 2nd to the 8th deciles.
HousesEvolution of the price per m² of houses since...
1 year
-5.5%
2 years
-10%
3 years
-14%
4 years
-8.1%
5 years
-7.3%
6 years
+19%
7 years
+13%
8 years
-7.6%
9 years
+13%
10 years
+8.7%
11 years
-2.6%
The price per m² of houses has decreased by 14% since 3 years, but it has increased by 19% in 6 years.

Yearly evolution

Evolution of the median price per m²

Evolution of the median price per m² - 59 - Petite-Forêt

Evolution of the number of transactions

Warning, last year incomplete. Projections made based on the proportions between semesters of the previous year at the departmental/national level and by type of property.

Evolution of the number of transactions - 59 - Petite-Forêt

Yearly data

Descending order
Year
Houses
house
transactions
Houses
house
Price per m²
Apartments
apt.
transactions
Apartments
apt.
Price per m²
2025
19
1 522 
1
1 443 
2024
29
1 611 
1
1 212 
2023
54
1 698 
8
1 226 
2022
40
1 760 
4
1 294 
2021
58
1 656 
6
1 084 
2020
43
1 641 
2
870 
2019
52
1 283 
6
1 020 
2018
50
1 342 
2
1 010 
2017
47
1 647 
4
910 
2016
41
1 341 
3
1 019 
2015
35
1 400 
1
1 167 
2014
44
1 562 
1
1 045 

Analysis

Structure of prices per m²

Values of price percentiles per m² over the periods used for the estimated price of each type of property.

Structure of transaction amounts

Values of transaction amounts percentiles over the periods used for the estimated price of each type of property.

Transaction amounts and prices per m² by percentile

Ascending order
Percentile
Houses
house
Price per m²
Houses
house
Transaction amount
Apartments
apt.
Price per m²
Apartments
apt.
Transaction amount
10th percentile
731 
57 400 
1 117 
64 830 
20th percentile
926 
78 000 
1 180 
68 800 
30th percentile
1 036 
86 400 
1 202 
80 000 
40th percentile
1 203 
102 K
1 212 
81 200 
50th percentile
1 522 
123 K
1 226 
86 500 
60th percentile
1 619 
161 K
1 255 
96 000 
70th percentile
1 943 
174 K
1 289 
102 K
80th percentile
2 129 
247 K
1 334 
111 K
90th percentile
2 242 
273 K
1 433 
114 K

National and departmental comparison

Evolution of the median price per m² of houses

Evolution of the median price per m² of apartments

Quarterly evolution

Evolution of the median price per m²

Evolution of the number of transactions

Quarterly data

Descending order
Quarter
Houses
house
transactions
Houses
house
Price per m²
Apartments
apt.
transactions
Apartments
apt.
Price per m²
2025 Q2
7
1 202 
0
--- 
2025 Q1
12
1 604 
1
1 443 
2024 Q4
3
1 115 
0
--- 
2024 Q3
10
1 647 
0
--- 
2024 Q2
10
1 470 
1
1 212 
2024 Q1
6
1 703 
0
--- 
2023 Q4
16
2 003 
2
1 205 
2023 Q3
13
1 373 
1
1 343 
2023 Q2
12
1 501 
3
1 239 
2023 Q1
13
2 000 
2
1 220 
2022 Q4
7
1 811 
0
--- 
2022 Q3
6
1 054 
2
1 142 
2022 Q2
14
1 996 
1
1 288 
2022 Q1
13
1 836 
1
1 348 
2021 Q4
19
1 351 
1
1 121 
2021 Q3
16
1 850 
2
968 
2021 Q2
10
1 664 
3
1 048 
2021 Q1
13
1 707 
0
--- 
2020 Q4
15
1 372 
0
--- 
2020 Q3
10
1 876 
1
1 025 
2020 Q2
9
1 673 
1
716 
2020 Q1
9
1 641 
0
--- 
2019 Q4
14
1 498 
2
1 068 
2019 Q3
16
1 283 
2
840 
2019 Q2
7
1 080 
2
985 
2019 Q1
15
1 082 
0
--- 
2018 Q4
10
1 129 
0
--- 
2018 Q3
15
1 373 
2
1 010 
2018 Q2
12
1 352 
0
--- 
2018 Q1
13
1 352 
0
--- 
2017 Q4
13
1 582 
0
--- 
2017 Q3
14
1 768 
1
955 
2017 Q2
8
1 730 
1
866 
2017 Q1
12
1 542 
2
946 
2016 Q4
6
821 
0
--- 
2016 Q3
14
1 611 
0
--- 
2016 Q2
12
1 330 
0
--- 
2016 Q1
9
1 229 
3
1 019 
2015 Q4
7
1 924 
0
--- 
2015 Q3
11
1 354 
0
--- 
2015 Q2
9
1 264 
1
1 167 
2015 Q1
8
1 222 
0
--- 
2014 Q4
22
1 758 
1
1 045 
2014 Q3
8
1 393 
0
--- 
2014 Q2
8
1 438 
0
--- 
2014 Q1
6
1 848 
0
--- 

Overview of the latest real estate transactions

The following list is an anonymized overview of the latest transactions. For more details and to find all transactions, please use the map to view transactions by plot or the transaction search page for a search by criteria.

2025-06-03
75 000 
938  /m²(80 m²)
Sale
Houses
House
3 rooms
80 m2
Land
800 m2
-Sols
Land
724 m2
-Terres
2025-04-29
84 000 
764  /m²(110 m²)
Sale
Houses
House
5 rooms
110 m2
2 outbuildings
Land
294 m2
-Sols
2025-04-28
166 000 
2 128  /m²(78 m²)
Sale
Houses
House
4 rooms
78 m2
Land
203 m2
-Sols
2025-04-28
43 000 
977  /m²(44 m²)
Sale
Houses
House
2 rooms
44 m2
Land
58 m2
-Sols
Land
37 m2
-Jardins
/Jardin potager
Land
60 m2
-Sols
2025-04-26
18 000 
Sale
1 outbuilding
Land
17 m2
-Sols
Land
18 m2
-Sols
Land
720 m2
-Sols
2025-04-25
104 990 
1 522  /m²(69 m²)
Sale
Houses
House
4 rooms
69 m2
Land
347 m2
-Sols
2025-04-14
122 600 
1 202  /m²(102 m²)
Sale
Houses
House
6 rooms
102 m2
Land
466 m2
-Sols
2025-04-09
175 750 
2 253  /m²(78 m²)
Sale
Houses
House
4 rooms
78 m2
Land
142 m2
-Sols
Land
60 m2
-Sols
2025-04-01
110 000 
Sale
Land
397 m2
-Sols
Land
110 m2
-Sols
Land
857 m2
-Jardins
/Jardin potager
2025-03-25
115 000 
Sale
Land
729 m2
-Terrains à bâtir
Land
748 m2
-Terrains à bâtir
2025-03-25
19 000 
211  /m²(90 m²)
Sale
Houses
House
3 rooms
90 m2
Land
592 m2
-Jardins
/Jardin potager
Land
579 m2
-Sols
Land
232 m2
-Jardins
/Jardin potager
2025-03-17
90 000 
1 125  /m²(80 m²)
Sale
Houses
House
3 rooms
80 m2
1 outbuilding
Land
356 m2
-Sols
2025-03-11
250 808 
2 239  /m²(112 m²)
Sale
Houses
House
4 rooms
112 m2
Land
231 m2
-Terrains à bâtir
Land
248 m2
-Terrains à bâtir
2025-02-20
101 000 
1 578  /m²(64 m²)
Sale
Houses
House
4 rooms
64 m2
Land
746 m2
-Sols
2025-02-20
1 400 000 
400  /m²(3500 m²)
Sale
Commercial property
3500 m2
Land
10382 m2
-Sols
2025-02-19
99 000 
541  /m²(183 m²)
692  /m²(143 m²)
Sale
Apartments
Apartment
2 rooms
35 m2
Apartments
Apartment
2 rooms
40 m2
Houses
House
2 rooms
68 m2
Commercial property
40 m2
2 outbuildings
Land
190 m2
-Sols
2025-02-17
61 000 
598  /m²(102 m²)
Sale
Houses
House
5 rooms
102 m2
1 outbuilding
Land
452 m2
-Sols
2025-02-17
272 000 
2 125  /m²(128 m²)
Sale
Houses
House
2 rooms
128 m2
1 outbuilding
Land
335 m2
-Sols
Land
248 m2
-Jardins
/Jardin potager
2025-02-14
245 000 
2 130  /m²(115 m²)
Sale
Houses
House
6 rooms
115 m2
Land
356 m2
-Sols
2025-02-14
275 000 
1 206  /m²(228 m²)
Sale
Houses
House
4 rooms
228 m2
1 outbuilding
Land
537 m2
-Sols
Land
587 m2
-Jardins
/Jardin potager
841 transactions listed in the municipality

Nord (59)

Most expensive cities

City
name
Descending orderHouses
house
Price per m²
4 288 
4 040 
3 690 
3 687 
3 679 
3 662 
3 504 
City
name
Descending orderApartments
apt.
Price per m²
222 500 
4 442 
4 266 
3 985 
3 879 
3 806 
3 766 
3 747 
3 694 
3 671 

Least expensive cities

City
name
Ascending orderHouses
house
Price per m²
585 
671 
746 
758 
786 
797 
816 
City
name
Ascending orderApartments
apt.
Price per m²
158 
204 
264 
282 
306 
353 
358