Real estate price map
Real estate price map in the municipality of Busigny, choose a section to see transactions by parcel.
Nord (59)
Price per m² in Busigny
Median price of real estate
in the municipality of Busigny
Houses
1 122 € /m²
Reliability 9/10
Median price on the 25 transactions of the last 6 months.
from 628 to
1 495 € /m²
1 495 € /m²
60% of transactions from the 2nd to the 8th deciles.
Apartments
584 € /m²
Reliability 3/10
Median price on the 6 transactions of the last 72 months.
Dwellings
1 122 € /m²
Reliability 9/10
Median price on the 25 transactions of the last 6 months.
from 628 to
1 495 € /m²
1 495 € /m²
60% of transactions from the 2nd to the 8th deciles.
Evolution of the price per m² of houses since...
1 year
+17%
2 years
+30%
3 years
+18%
4 years
+18%
5 years
+22%
6 years
+38%
7 years
+21%
8 years
+23%
9 years
+52%
10 years
+15%
11 years
+10%
561 transactions listed in the municipality
Yearly data
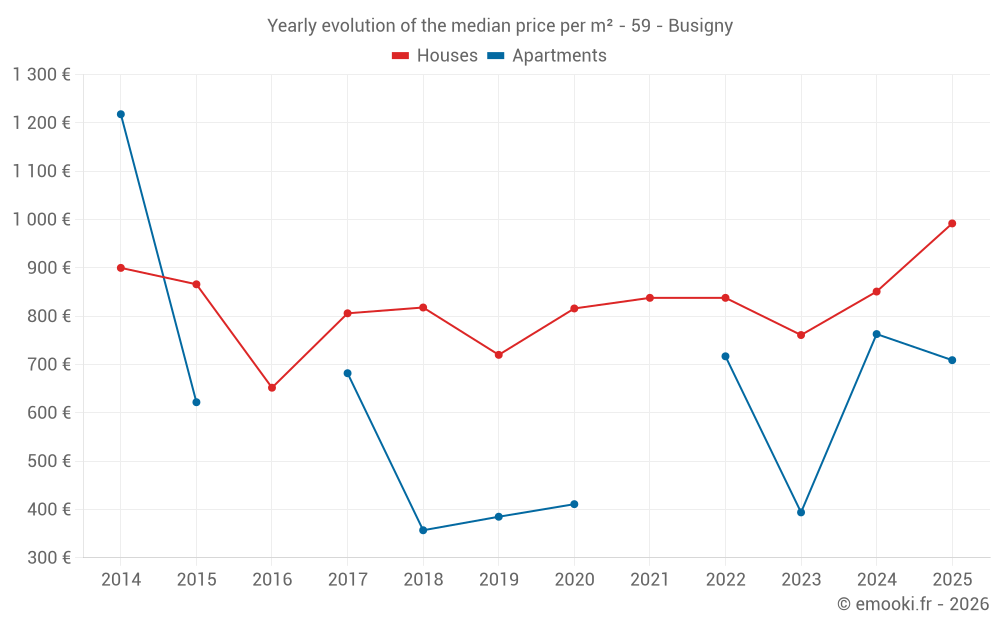
Yearly evolution of the median price per m²
Yearly evolution of the number of transactions

Yearly table
Year
house
transactions
transactions
house
Price per m²
Price per m²
apt.
transactions
transactions
apt.
Price per m²
Price per m²
2025
42
992 €
1
709 €
2024
22
851 €
1
763 €
2023
21
761 €
2
394 €
2022
44
838 €
1
717 €
2021
38
838 €
0
--- €
2020
32
816 €
1
411 €
2019
32
720 €
3
385 €
2018
32
818 €
1
357 €
2017
20
806 €
1
682 €
2016
32
652 €
0
--- €
2015
29
866 €
1
622 €
2014
18
900 €
1
1 218 €
Analysis
Structure of prices per m²
Values of price percentiles per m² over the periods used for the estimated price of each type of property.
Structure of transaction amounts
Values of transaction amounts percentiles over the periods used for the estimated price of each type of property.
Transaction amounts and prices per m² by percentile
Percentile
house
Price per m²
Price per m²
house
Transaction amount
Transaction amount
apt.
Price per m²
Price per m²
apt.
Transaction amount
Transaction amount
10th percentile
528 €
40 400 €
370 €
80 000 €
20th percentile
628 €
54 000 €
411 €
100 K€
30th percentile
659 €
71 800 €
435 €
103 K€
40th percentile
862 €
82 200 €
459 €
105 K€
50th percentile
1 122 €
100 K€
584 €
116 K€
60th percentile
1 194 €
114 K€
709 €
126 K€
70th percentile
1 413 €
132 K€
713 €
133 K€
80th percentile
1 495 €
151 K€
717 €
140 K€
90th percentile
1 561 €
161 K€
740 €
146 K€
National and departmental comparison
Evolution of the median price per m² of houses
Evolution of the median price per m² of apartments
Quarterly data
Quarterly evolution of the median price per m²
Quarterly evolution of the number of transactions
Quarterly table
Quarter
house
transactions
transactions
house
Price per m²
Price per m²
apt.
transactions
transactions
apt.
Price per m²
Price per m²
2025 Q4
9
1 182 €
0
--- €
2025 Q3
16
1 118 €
0
--- €
2025 Q2
11
977 €
1
709 €
2025 Q1
6
834 €
0
--- €
2024 Q4
8
796 €
0
--- €
2024 Q3
7
845 €
0
--- €
2024 Q2
3
857 €
1
763 €
2024 Q1
4
1 022 €
0
--- €
2023 Q4
4
632 €
1
459 €
2023 Q3
5
1 045 €
0
--- €
2023 Q2
7
720 €
1
328 €
2023 Q1
5
761 €
0
--- €
2022 Q4
9
729 €
0
--- €
2022 Q3
13
667 €
1
717 €
2022 Q2
13
1 176 €
0
--- €
2022 Q1
9
753 €
0
--- €
2021 Q4
11
874 €
0
--- €
2021 Q3
9
1 006 €
0
--- €
2021 Q2
11
811 €
0
--- €
2021 Q1
7
737 €
0
--- €
2020 Q4
13
846 €
1
411 €
2020 Q3
5
945 €
0
--- €
2020 Q2
9
778 €
0
--- €
2020 Q1
5
581 €
0
--- €
2019 Q4
10
830 €
0
--- €
2019 Q3
9
733 €
3
385 €
2019 Q2
6
692 €
0
--- €
2019 Q1
7
668 €
0
--- €
2018 Q4
11
944 €
0
--- €
2018 Q3
10
818 €
0
--- €
2018 Q2
3
1 184 €
1
357 €
2018 Q1
8
565 €
0
--- €
2017 Q4
5
952 €
0
--- €
2017 Q3
6
905 €
1
682 €
2017 Q2
4
802 €
0
--- €
2017 Q1
5
667 €
0
--- €
2016 Q4
8
588 €
0
--- €
2016 Q3
11
732 €
0
--- €
2016 Q2
7
584 €
0
--- €
2016 Q1
6
748 €
0
--- €
2015 Q4
13
741 €
0
--- €
2015 Q3
8
1 029 €
0
--- €
2015 Q2
5
719 €
0
--- €
2015 Q1
3
1 315 €
1
622 €
2014 Q4
6
1 568 €
1
1 218 €
2014 Q3
7
765 €
0
--- €
2014 Q2
4
868 €
0
--- €
2014 Q1
1
602 €
0
--- €
Key takeaways
What is the price per m2 of houses in Busigny?
The median price on the 25 house transactions of the last 6 months in the municipality of Busigny was 1 122 € per square meter for a median property value of 100 000 €. Over this period, 60% of transactions were between 628 and 1 495 € per square meter (from the 2nd to the 8th deciles).
Compare with neighboring municipalities
City
name
name
house
Price per m²
Price per m²
apt.
Price per m²
Price per m²
City information
Zip code
- 59137 BUSIGNY