emooki
HomePrice mapTransactions
🇬🇧 English🇫🇷 Français🇩🇪 Deutsch🇪🇸 Español🇮🇹 Italiano

Real estate price map


Real estate price map in the municipality of La Madeleine, choose a section to see transactions by parcel.

Nord (59)

La Madeleine - Real estate price m²

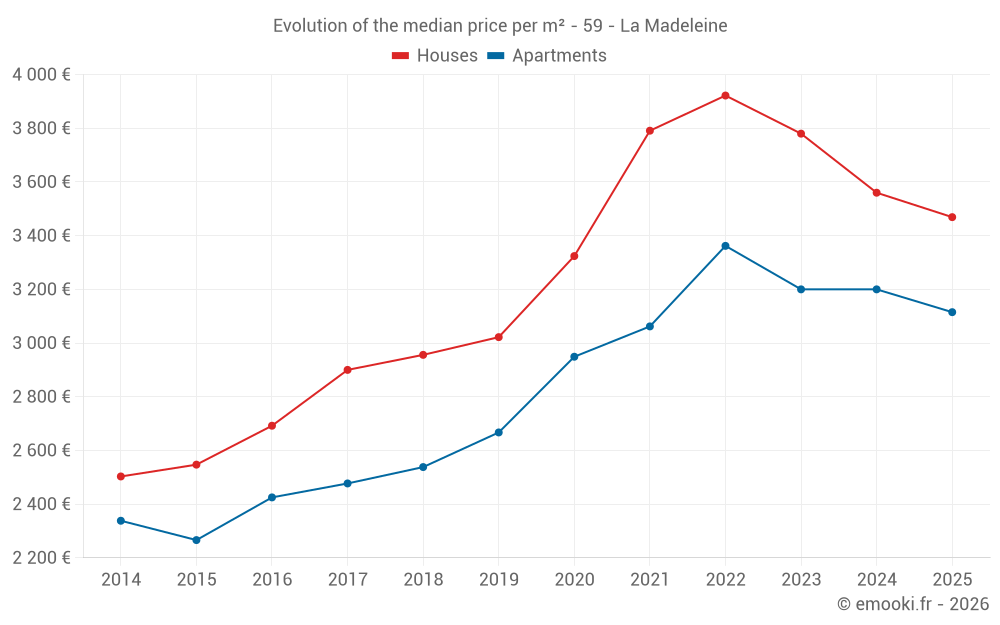
Median price of real estate
in the municipality of La Madeleine

HousesHouses
3 690  /m²
1-23-45-67-89-10
Reliability 10/10
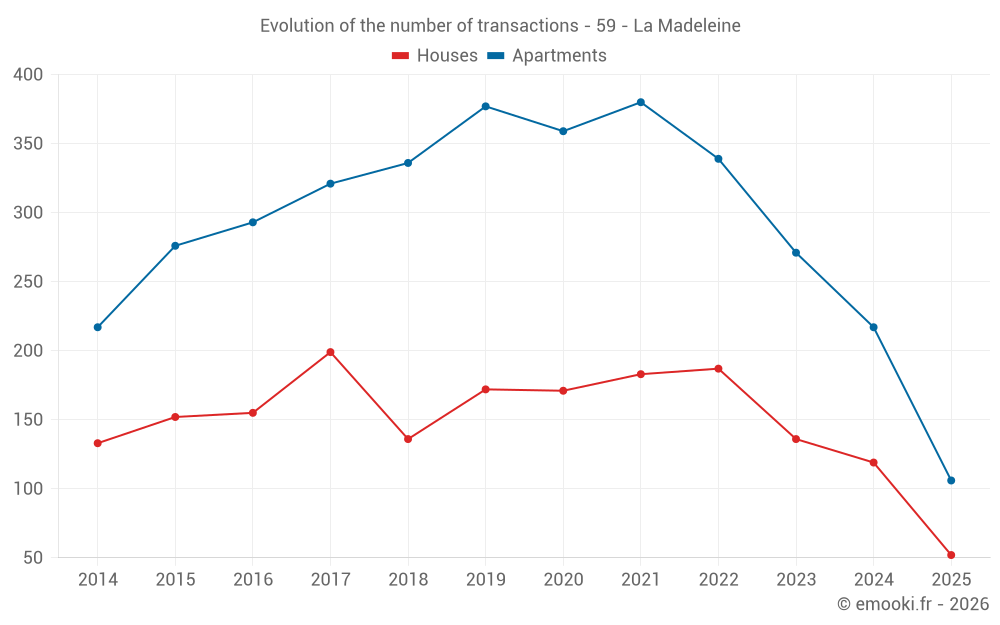
Median price on the 22 transactions of the last 3 months.
from 2 418 to
4 416  /m²
60% of transactions from the 2nd to the 8th deciles.
ApartmentsApartments
3 173  /m²
1-23-45-67-89-10
Reliability 10/10
Median price on the 35 transactions of the last 3 months.
from 2 585 to
3 695  /m²
60% of transactions from the 2nd to the 8th deciles.
DwellingsDwellings
3 291  /m²
1-23-45-67-89-10
Reliability 10/10
Median price on the 57 transactions of the last 3 months.
from 2 574 to
4 043  /m²
60% of transactions from the 2nd to the 8th deciles.
HousesEvolution of the price per m² of houses since...
1 year
-2.6%
2 years
-8.2%
3 years
-12%
4 years
-8.5%
5 years
+4.4%
6 years
+15%
7 years
+17%
8 years
+20%
9 years
+29%
10 years
+36%
11 years
+39%
The price per m² of houses has decreased by 12% since 3 years, but it has increased by 39% in 11 years.
ApartmentsEvolution of the price per m² of apartments since...
1 year
-2.7%
2 years
-2.7%
3 years
-7.3%
4 years
+1.7%
5 years
+5.6%
6 years
+17%
7 years
+23%
8 years
+26%
9 years
+28%
10 years
+37%
11 years
+33%
The price per m² of apartments has decreased by 7.3% since 3 years, but it has increased by 37% in 10 years.

Yearly evolution

Evolution of the median price per m²

Evolution of the median price per m² - 59 - La Madeleine

Evolution of the number of transactions

Warning, last year incomplete. Projections made based on the proportions between semesters of the previous year at the departmental/national level and by type of property.

Evolution of the number of transactions - 59 - La Madeleine

Yearly data

Descending order
Year
Houses
house
transactions
Houses
house
Price per m²
Apartments
apt.
transactions
Apartments
apt.
Price per m²
2025
52
3 469 
106
3 115 
2024
119
3 560 
217
3 200 
2023
136
3 780 
271
3 200 
2022
187
3 922 
339
3 362 
2021
183
3 791 
380
3 062 
2020
171
3 324 
359
2 949 
2019
172
3 022 
377
2 667 
2018
136
2 956 
336
2 538 
2017
199
2 900 
321
2 477 
2016
155
2 692 
293
2 425 
2015
152
2 547 
276
2 266 
2014
133
2 503 
217
2 338 

Analysis

Structure of prices per m²

Values of price percentiles per m² over the periods used for the estimated price of each type of property.

Structure of transaction amounts

Values of transaction amounts percentiles over the periods used for the estimated price of each type of property.

Transaction amounts and prices per m² by percentile

Ascending order
Percentile
Houses
house
Price per m²
Houses
house
Transaction amount
Apartments
apt.
Price per m²
Apartments
apt.
Transaction amount
10th percentile
1 944 
160 K
2 436 
102 K
20th percentile
2 418 
222 K
2 585 
120 K
30th percentile
3 084 
262 K
2 818 
161 K
40th percentile
3 419 
278 K
3 059 
179 K
50th percentile
3 690 
332 K
3 173 
200 K
60th percentile
3 917 
344 K
3 332 
222 K
70th percentile
4 073 
376 K
3 543 
239 K
80th percentile
4 416 
557 K
3 695 
269 K
90th percentile
5 367 
732 K
4 041 
320 K

National and departmental comparison

Evolution of the median price per m² of houses

Evolution of the median price per m² of apartments

Quarterly evolution

Evolution of the median price per m²

Evolution of the number of transactions

Quarterly data

Descending order
Quarter
Houses
house
transactions
Houses
house
Price per m²
Apartments
apt.
transactions
Apartments
apt.
Price per m²
2025 Q2
22
3 690 
35
3 173 
2025 Q1
30
3 252 
71
3 083 
2024 Q4
31
3 409 
64
3 082 
2024 Q3
31
3 761 
46
3 242 
2024 Q2
40
3 540 
59
3 210 
2024 Q1
17
3 438 
48
3 192 
2023 Q4
29
3 609 
70
3 154 
2023 Q3
41
3 792 
62
3 484 
2023 Q2
25
3 886 
83
3 091 
2023 Q1
41
3 833 
56
3 140 
2022 Q4
49
3 919 
76
3 378 
2022 Q3
58
3 937 
106
3 196 
2022 Q2
47
3 716 
77
3 330 
2022 Q1
33
4 103 
80
3 486 
2021 Q4
38
3 910 
83
3 028 
2021 Q3
63
3 923 
105
3 179 
2021 Q2
40
3 884 
98
3 128 
2021 Q1
42
3 180 
94
2 952 
2020 Q4
47
3 400 
107
3 033 
2020 Q3
48
3 400 
89
3 017 
2020 Q2
40
3 361 
80
2 810 
2020 Q1
36
3 151 
83
3 002 
2019 Q4
32
2 775 
101
2 722 
2019 Q3
57
3 425 
103
2 953 
2019 Q2
39
2 736 
89
2 563 
2019 Q1
44
3 095 
84
2 490 
2018 Q4
33
3 471 
99
2 743 
2018 Q3
42
3 211 
71
2 537 
2018 Q2
30
2 906 
82
2 592 
2018 Q1
31
2 661 
84
2 458 
2017 Q4
48
2 994 
61
2 599 
2017 Q3
49
2 885 
96
2 600 
2017 Q2
46
2 580 
82
2 350 
2017 Q1
56
3 109 
82
2 402 
2016 Q4
51
2 742 
77
2 361 
2016 Q3
43
2 796 
72
2 488 
2016 Q2
33
2 644 
72
2 474 
2016 Q1
28
2 612 
72
2 440 
2015 Q4
39
2 426 
78
2 301 
2015 Q3
50
2 384 
72
2 178 
2015 Q2
32
2 596 
69
2 216 
2015 Q1
31
2 784 
57
2 396 
2014 Q4
28
2 360 
41
2 431 
2014 Q3
47
2 503 
57
2 451 
2014 Q2
30
2 771 
59
2 273 
2014 Q1
28
2 205 
60
2 245 

Overview of the latest real estate transactions

The following list is an anonymized overview of the latest transactions. For more details and to find all transactions, please use the map to view transactions by plot or the transaction search page for a search by criteria.

2025-06-30
185 000 
2 803  /m²(66 m²)
Sale
Apartments
Apartment
2 rooms
66 m2
3 outbuildings
2025-06-30
200 000 
2 299  /m²(87 m²)
Sale
Houses
House
5 rooms
87 m2
Land
99 m2
-Sols
2025-06-30
570 000 
5 327  /m²(107 m²)
Sale
Apartments
Apartment
3 rooms
107 m2
2 outbuildings
Land
90 m2
-Sols
1 outbuilding
Land
17 m2
-Sols
Land
494 m2
-Sols
2025-06-25
250 000 
3 676  /m²(68 m²)
Sale
1 outbuilding
Land
21 m2
-Sols
Houses
House
4 rooms
68 m2
Land
214 m2
-Sols
2025-06-23
26 000 
Sale
1 outbuilding
2025-06-18
190 000 
3 115  /m²(61 m²)
Sale
Apartments
Apartment
2 rooms
61 m2
1 outbuilding
2025-06-17
135 000 
2 596  /m²(52 m²)
Sale
Apartments
Apartment
3 rooms
52 m2
2025-06-12
494 000 
2 839  /m²(174 m²)
Sale
Commercial property
150 m2
Commercial property
12 m2
Commercial property
12 m2
1 outbuilding
2025-06-12
613 899 
4 722  /m²(130 m²)
Sale
Apartments
Apartment
5 rooms
130 m2
1 outbuilding
2025-06-10
155 000 
1 938  /m²(80 m²)
Sale
Houses
House
4 rooms
80 m2
Land
300 m2
-Sols
2025-06-09
107 000 
3 963  /m²(27 m²)
Sale
Apartments
Apartment
1 room
27 m2
1 outbuilding
2025-06-06
157 000 
2 275  /m²(69 m²)
Sale
Land
36 m2
-Sols
Houses
House
3 rooms
69 m2
Land
10 m2
-Sols
2025-06-06
266 000 
2 418  /m²(110 m²)
Sale
Apartments
Apartment
5 rooms
110 m2
2 outbuildings
2025-06-05
347 000 
2 892  /m²(120 m²)
Sale
Houses
House
6 rooms
120 m2
Land
143 m2
-Sols
2025-06-04
380 000 
5 507  /m²(69 m²)
Sale
Houses
House
4 rooms
69 m2
Land
114 m2
-Sols
2025-06-04
90 000 
2 000  /m²(45 m²)
Sale
Apartments
Apartment
2 rooms
45 m2
2025-06-02
21 000 
Sale
1 outbuilding
Land
15 m2
-Sols
2025-06-02
795 000 
4 441  /m²(179 m²)
5 032  /m²(158 m²)
Sale
Houses
House
4 rooms
158 m2
Commercial property
21 m2
Land
249 m2
-Sols
2025-05-28
740 000 
4 485  /m²(165 m²)
Sale
Houses
House
6 rooms
165 m2
Land
188 m2
-Sols
2025-05-28
215 000 
3 028  /m²(71 m²)
Sale
Houses
House
5 rooms
71 m2
Land
170 m2
-Sols
7174 transactions listed in the municipality

Nord (59)

Most expensive cities

City
name
Descending orderHouses
house
Price per m²
4 288 
4 040 
3 690 
3 687 
3 679 
3 662 
3 504 
City
name
Descending orderApartments
apt.
Price per m²
222 500 
4 442 
4 266 
3 985 
3 879 
3 806 
3 766 
3 747 
3 694 
3 671 

Least expensive cities

City
name
Ascending orderHouses
house
Price per m²
585 
671 
746 
758 
786 
797 
816 
City
name
Ascending orderApartments
apt.
Price per m²
158 
204 
264 
282 
306 
353 
358