Real estate price map
Real estate price map in the municipality of Solesmes, choose a section to see transactions by parcel.
Nord (59)
Price per m² in Solesmes
Median price of real estate
in the municipality of Solesmes
Houses
966 € /m²
Reliability 9/10
Median price on the 38 transactions of the last 6 months.
from 661 to
1 470 € /m²
1 470 € /m²
60% of transactions from the 2nd to the 8th deciles.
Apartments
672 € /m²
Reliability 4/10
Median price on the 8 transactions of the last 60 months.
Dwellings
963 € /m²
Reliability 9/10
Median price on the 39 transactions of the last 6 months.
from 663 to
1 443 € /m²
1 443 € /m²
60% of transactions from the 2nd to the 8th deciles.
Evolution of the price per m² of houses since...
1 year
-1%
2 years
+12%
3 years
+6.2%
4 years
-1.9%
5 years
+13%
6 years
+11%
7 years
+14%
8 years
-1.9%
9 years
+11%
10 years
+23%
11 years
+8.5%
The price per m² of houses has decreased by 1.9% since 4 years, but it has increased by 23% in 10 years.
1020 transactions listed in the municipality
Yearly data
Yearly evolution of the median price per m²

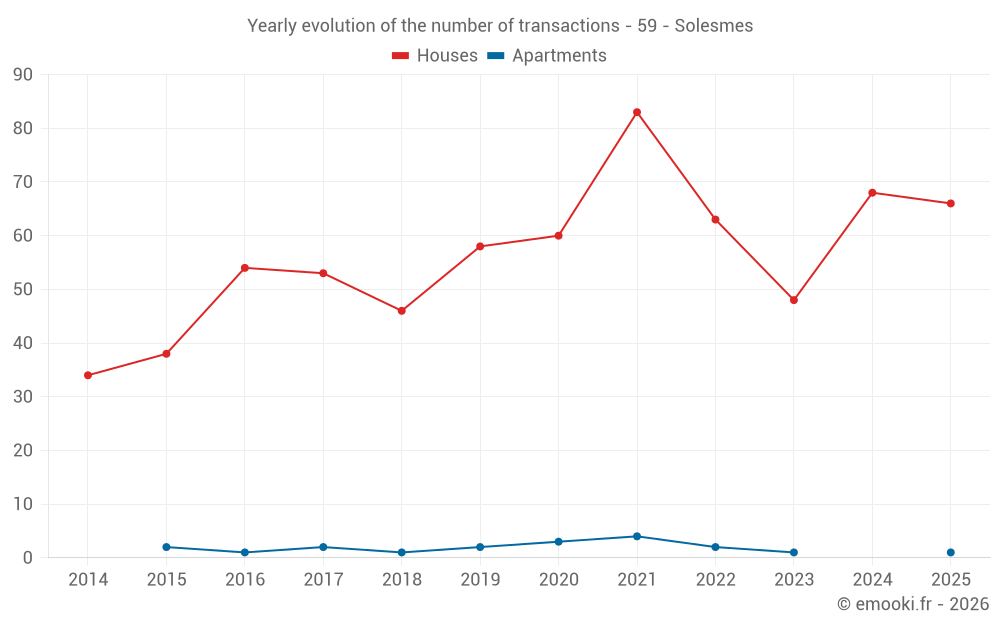
Yearly evolution of the number of transactions
Yearly table
Year
house
transactions
transactions
house
Price per m²
Price per m²
apt.
transactions
transactions
apt.
Price per m²
Price per m²
2025
66
944 €
1
821 €
2024
68
954 €
0
--- €
2023
48
840 €
1
445 €
2022
63
889 €
2
550 €
2021
83
962 €
4
804 €
2020
60
833 €
3
588 €
2019
58
852 €
2
1 072 €
2018
46
826 €
1
1 173 €
2017
53
962 €
2
196 €
2016
54
851 €
1
881 €
2015
38
770 €
2
2 418 €
2014
34
870 €
0
--- €
Analysis
Structure of prices per m²
Values of price percentiles per m² over the periods used for the estimated price of each type of property.
Structure of transaction amounts
Values of transaction amounts percentiles over the periods used for the estimated price of each type of property.
Transaction amounts and prices per m² by percentile
Percentile
house
Price per m²
Price per m²
house
Transaction amount
Transaction amount
apt.
Price per m²
Price per m²
apt.
Transaction amount
Transaction amount
10th percentile
485 €
39 400 €
433 €
74 480 €
20th percentile
661 €
56 200 €
446 €
79 440 €
30th percentile
823 €
75 000 €
467 €
84 700 €
40th percentile
870 €
87 800 €
609 €
89 600 €
50th percentile
966 €
95 500 €
672 €
94 500 €
60th percentile
1 105 €
101 K€
719 €
101 K€
70th percentile
1 280 €
115 K€
808 €
113 K€
80th percentile
1 470 €
127 K€
904 €
145 K€
90th percentile
1 736 €
160 K€
967 €
180 K€
National and departmental comparison
Evolution of the median price per m² of houses
Evolution of the median price per m² of apartments
Quarterly data
Quarterly evolution of the median price per m²
Quarterly evolution of the number of transactions
Quarterly table
Quarter
house
transactions
transactions
house
Price per m²
Price per m²
apt.
transactions
transactions
apt.
Price per m²
Price per m²
2025 Q4
16
966 €
0
--- €
2025 Q3
22
966 €
1
821 €
2025 Q2
15
1 088 €
0
--- €
2025 Q1
13
790 €
0
--- €
2024 Q4
20
1 126 €
0
--- €
2024 Q3
15
688 €
0
--- €
2024 Q2
21
992 €
0
--- €
2024 Q1
12
1 036 €
0
--- €
2023 Q4
14
634 €
0
--- €
2023 Q3
14
890 €
1
445 €
2023 Q2
6
652 €
0
--- €
2023 Q1
14
1 034 €
0
--- €
2022 Q4
17
889 €
1
406 €
2022 Q3
18
918 €
1
693 €
2022 Q2
13
938 €
0
--- €
2022 Q1
15
885 €
0
--- €
2021 Q4
23
843 €
0
--- €
2021 Q3
21
1 074 €
0
--- €
2021 Q2
20
960 €
2
703 €
2021 Q1
19
914 €
2
818 €
2020 Q4
23
870 €
1
451 €
2020 Q3
14
860 €
0
--- €
2020 Q2
10
758 €
1
818 €
2020 Q1
13
804 €
1
588 €
2019 Q4
16
932 €
1
1 144 €
2019 Q3
21
833 €
0
--- €
2019 Q2
8
835 €
0
--- €
2019 Q1
13
859 €
1
1 000 €
2018 Q4
15
909 €
0
--- €
2018 Q3
10
814 €
1
1 173 €
2018 Q2
12
775 €
0
--- €
2018 Q1
9
1 040 €
0
--- €
2017 Q4
13
965 €
2
196 €
2017 Q3
18
1 032 €
0
--- €
2017 Q2
13
873 €
0
--- €
2017 Q1
9
716 €
0
--- €
2016 Q4
14
690 €
0
--- €
2016 Q3
18
1 086 €
0
--- €
2016 Q2
9
830 €
1
881 €
2016 Q1
13
872 €
0
--- €
2015 Q4
11
746 €
0
--- €
2015 Q3
7
771 €
2
2 418 €
2015 Q2
11
675 €
0
--- €
2015 Q1
9
1 068 €
0
--- €
2014 Q4
6
782 €
0
--- €
2014 Q3
7
917 €
0
--- €
2014 Q2
12
870 €
0
--- €
2014 Q1
9
878 €
0
--- €
Key takeaways
What is the price per m2 of houses in Solesmes?
The median price on the 38 house transactions of the last 6 months in the municipality of Solesmes was 966 € per square meter for a median property value of 95 500 €. Over this period, 60% of transactions were between 661 and 1 470 € per square meter (from the 2nd to the 8th deciles).
Compare with neighboring municipalities
City
name
name
house
Price per m²
Price per m²
apt.
Price per m²
Price per m²
City information
Zip code
- 59730 SOLESMES