emooki
HomePrice mapTransactions
🇬🇧 English🇫🇷 Français🇩🇪 Deutsch🇪🇸 Español🇮🇹 Italiano

Real estate price map


Real estate price map in the municipality of Gestel, choose a section to see transactions by parcel.

Morbihan (56)

Gestel - Real estate price m²

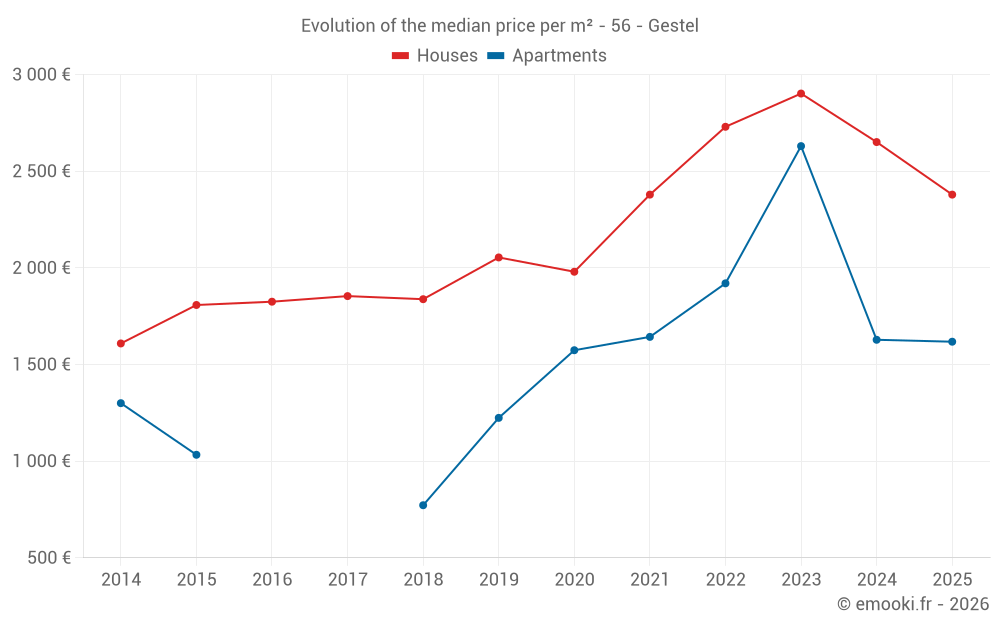
Median price of real estate
in the municipality of Gestel

HousesHouses
2 579  /m²
1-23-45-67-89-10
Reliability 8/10
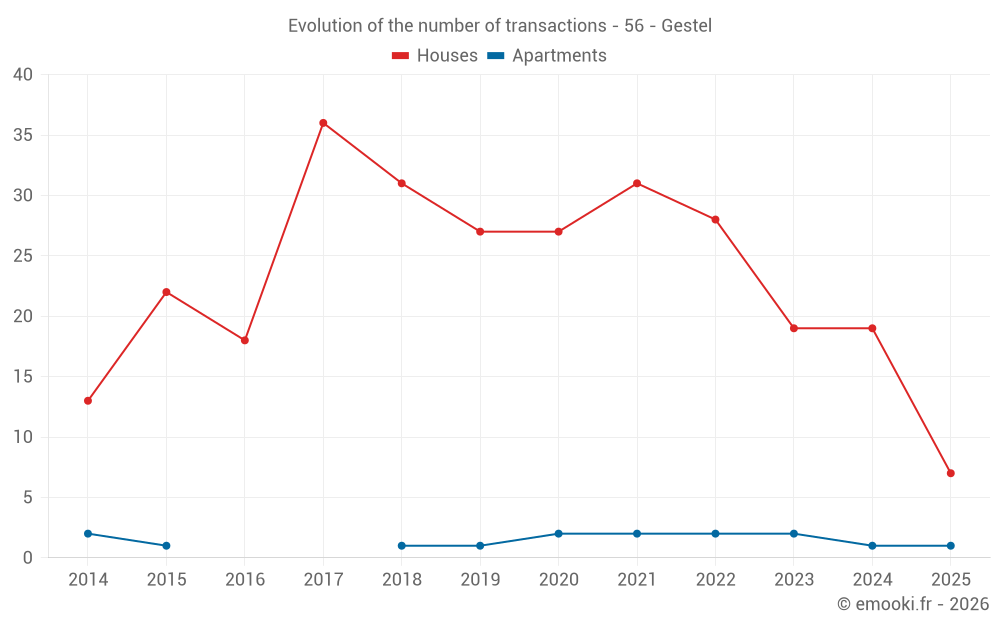
Median price on the 19 transactions of the last 12 months.
from 2 160 to
3 189  /m²
60% of transactions from the 2nd to the 8th deciles.
ApartmentsApartments
1 628  /m²
1-23-45-67-89-10
Reliability 4/10
Median price on the 9 transactions of the last 60 months.
DwellingsDwellings
2 436  /m²
1-23-45-67-89-10
Reliability 8/10
Median price on the 21 transactions of the last 12 months.
from 2 078 to
3 059  /m²
60% of transactions from the 2nd to the 8th deciles.
HousesEvolution of the price per m² of houses since...
1 year
-10%
2 years
-18%
3 years
-13%
4 years
0%
5 years
+20%
6 years
+16%
7 years
+29%
8 years
+28%
9 years
+30%
10 years
+32%
11 years
+48%
The price per m² of houses has decreased by 18% since 2 years, but it has increased by 48% in 11 years.

Yearly evolution

Evolution of the median price per m²

Evolution of the median price per m² - 56 - Gestel

Evolution of the number of transactions

Warning, last year incomplete. Projections made based on the proportions between semesters of the previous year at the departmental/national level and by type of property.

Evolution of the number of transactions - 56 - Gestel

Yearly data

Descending order
Year
Houses
house
transactions
Houses
house
Price per m²
Apartments
apt.
transactions
Apartments
apt.
Price per m²
2025
7
2 379 
1
1 618 
2024
19
2 651 
1
1 628 
2023
19
2 902 
2
2 630 
2022
28
2 730 
2
1 920 
2021
31
2 379 
2
1 643 
2020
27
1 980 
2
1 574 
2019
27
2 054 
1
1 224 
2018
31
1 838 
1
772 
2017
36
1 854 
0
--- 
2016
18
1 825 
0
--- 
2015
22
1 808 
1
1 033 
2014
13
1 609 
2
1 300 

Analysis

Structure of prices per m²

Values of price percentiles per m² over the periods used for the estimated price of each type of property.

Structure of transaction amounts

Values of transaction amounts percentiles over the periods used for the estimated price of each type of property.

Transaction amounts and prices per m² by percentile

Ascending order
Percentile
Houses
house
Price per m²
Houses
house
Transaction amount
Apartments
apt.
Price per m²
Apartments
apt.
Transaction amount
10th percentile
2 006 
210 K
1 401 
79 940 
20th percentile
2 160 
223 K
1 513 
91 080 
30th percentile
2 302 
264 K
1 556 
99 040 
40th percentile
2 415 
282 K
1 620 
104 K
50th percentile
2 579 
292 K
1 628 
120 K
60th percentile
2 879 
319 K
1 874 
120 K
70th percentile
3 039 
341 K
2 170 
132 K
80th percentile
3 189 
366 K
2 326 
151 K
90th percentile
3 570 
385 K
2 611 
194 K

National and departmental comparison

Evolution of the median price per m² of houses

Evolution of the median price per m² of apartments

Quarterly evolution

Evolution of the median price per m²

Evolution of the number of transactions

Quarterly data

Descending order
Quarter
Houses
house
transactions
Houses
house
Price per m²
Apartments
apt.
transactions
Apartments
apt.
Price per m²
2025 Q2
3
2 379 
1
1 618 
2025 Q1
4
2 818 
0
--- 
2024 Q4
4
2 545 
1
1 628 
2024 Q3
8
2 615 
0
--- 
2024 Q2
3
3 246 
0
--- 
2024 Q1
4
2 698 
0
--- 
2023 Q4
3
2 939 
1
1 511 
2023 Q3
9
2 756 
0
--- 
2023 Q2
4
2 798 
1
3 750 
2023 Q1
3
3 009 
0
--- 
2022 Q4
7
2 696 
2
1 920 
2022 Q3
8
2 775 
0
--- 
2022 Q2
5
2 544 
0
--- 
2022 Q1
8
3 060 
0
--- 
2021 Q4
3
2 865 
0
--- 
2021 Q3
13
2 121 
0
--- 
2021 Q2
8
2 454 
0
--- 
2021 Q1
7
2 500 
2
1 643 
2020 Q4
8
2 183 
1
1 935 
2020 Q3
6
2 194 
0
--- 
2020 Q2
8
1 936 
0
--- 
2020 Q1
5
1 917 
1
1 214 
2019 Q4
11
2 024 
1
1 224 
2019 Q3
4
2 081 
0
--- 
2019 Q2
8
1 772 
0
--- 
2019 Q1
4
2 362 
0
--- 
2018 Q4
7
1 918 
0
--- 
2018 Q3
8
1 988 
0
--- 
2018 Q2
7
1 776 
1
772 
2018 Q1
9
1 635 
0
--- 
2017 Q4
13
1 829 
0
--- 
2017 Q3
10
2 072 
0
--- 
2017 Q2
8
1 661 
0
--- 
2017 Q1
5
2 348 
0
--- 
2016 Q4
4
2 048 
0
--- 
2016 Q3
6
1 662 
0
--- 
2016 Q2
3
1 469 
0
--- 
2016 Q1
5
1 837 
0
--- 
2015 Q4
7
2 361 
0
--- 
2015 Q3
8
1 508 
1
1 033 
2015 Q2
3
1 653 
0
--- 
2015 Q1
4
1 770 
0
--- 
2014 Q4
3
1 333 
0
--- 
2014 Q3
4
1 837 
0
--- 
2014 Q2
3
1 504 
1
1 578 
2014 Q1
3
2 277 
1
1 022 

Overview of the latest real estate transactions

The following list is an anonymized overview of the latest transactions. For more details and to find all transactions, please use the map to view transactions by plot or the transaction search page for a search by criteria.

2025-06-03
79 300 
1 618  /m²(49 m²)
Sale
Apartments
Apartment
1 room
49 m2
2025-04-28
631 586 
3 828  /m²(165 m²)
Sale
Houses
House
6 rooms
165 m2
1 outbuilding
Land
833 m2
-Sols
Land
1077 m2
-Terres
Land
5020 m2
-Terrains d'agrément
Land
4600 m2
-Terres
Land
55 m2
-Sols
2025-04-28
290 000 
2 164  /m²(134 m²)
Sale
Houses
House
5 rooms
134 m2
Land
898 m2
-Terrains d'agrément
Land
602 m2
-Sols
Land
358 m2
-Terrains d'agrément
2025-04-24
345 000 
2 379  /m²(145 m²)
Sale
Houses
House
2 rooms
36 m2
Houses
House
3 rooms
109 m2
Land
2985 m2
-Terrains d'agrément
Land
540 m2
-Sols
Land
361 m2
-Terres
Land
37 m2
-Sols
Land
143 m2
-Sols
2025-02-19
375 000 
3 505  /m²(107 m²)
Sale
Houses
House
5 rooms
107 m2
Land
749 m2
-Sols
2025-02-19
270 000 
2 250  /m²(120 m²)
Sale
Houses
House
5 rooms
120 m2
Land
1017 m2
-Sols
Land
211 m2
-Terres
2025-01-24
225 000 
1 718  /m²(131 m²)
Sale
Houses
House
6 rooms
131 m2
1 outbuilding
Land
641 m2
-Sols
2025-01-20
325 000 
3 385  /m²(96 m²)
Sale
Houses
House
4 rooms
96 m2
Land
342 m2
-Sols
2024-12-30
140 000 
1 628  /m²(86 m²)
Sale
Apartments
Apartment
3 rooms
86 m2
2024-12-18
260 000 
3 059  /m²(85 m²)
Sale
Houses
House
5 rooms
85 m2
Land
364 m2
-Sols
2024-12-12
367 000 
2 936  /m²(125 m²)
Sale
Houses
House
4 rooms
125 m2
1 outbuilding
Land
424 m2
-Sols
Land
1170 m2
-Terrains d'agrément
2024-12-02
280 000 
2 154  /m²(130 m²)
Sale
Houses
House
6 rooms
130 m2
Land
927 m2
-Sols
Land
38 m2
-Prés
2024-11-12
210 000 
1 273  /m²(165 m²)
Sale
Houses
House
4 rooms
165 m2
Land
964 m2
-Sols
Land
786 m2
-Jardins
Land
227 m2
-Sols
2024-10-29
101 
Sale
Land
3940 m2
-Futaies feuillues
2024-10-11
144 000 
Sale
Land
161314 m2
-Terres
Land
25742 m2
-Prés
Land
20080 m2
-Futaies feuillues
Land
8590 m2
-Terres
Land
3390 m2
-Landes
Land
616 m2
-Jardins
Land
264 m2
-Sols
Land
50755 m2
-Terres
Land
3917 m2
-Taillis simples
Land
28120 m2
-Prés
Land
739 m2
-Landes
2024-08-21
365 000 
4 101  /m²(89 m²)
Sale
Houses
House
2 rooms
89 m2
Land
2354 m2
-Terres
2024-08-06
295 100 
2 078  /m²(142 m²)
Sale
Houses
House
6 rooms
142 m2
Land
446 m2
-Sols
2024-08-02
200 000 
2 410  /m²(83 m²)
Sale
Houses
House
5 rooms
83 m2
Land
500 m2
-Sols
2024-07-29
209 500 
2 436  /m²(86 m²)
Sale
Houses
House
4 rooms
86 m2
Land
216 m2
-Sols
Land
2 m2
-Terrains à bâtir
2024-07-26
423 000 
2 579  /m²(164 m²)
Sale
Houses
House
5 rooms
164 m2
1 outbuilding
Land
582 m2
-Sols
450 transactions listed in the municipality

Morbihan (56)

Most expensive cities

City
name
Descending orderHouses
house
Price per m²
6 560 
5 843 
5 741 
5 625 
5 440 
5 366 
5 319 
5 302 
5 112 
City
name
Descending orderApartments
apt.
Price per m²
6 879 
5 986 
5 736 
5 232 
5 000 
4 948 
4 613 

Least expensive cities

City
name
Ascending orderHouses
house
Price per m²
747 
788 
904 
920 
921 
949 
1 020 
City
name
Ascending orderApartments
apt.
Price per m²
167 
325 
368 
388 
417 
430 
432 
458 
475 
482