emooki
HomePrice mapTransactions
🇬🇧 English🇫🇷 Français🇩🇪 Deutsch🇪🇸 Español🇮🇹 Italiano

Real estate price map


Real estate price map in the municipality of Guidel, choose a section to see transactions by parcel.

Morbihan (56)

Guidel - Real estate price m²

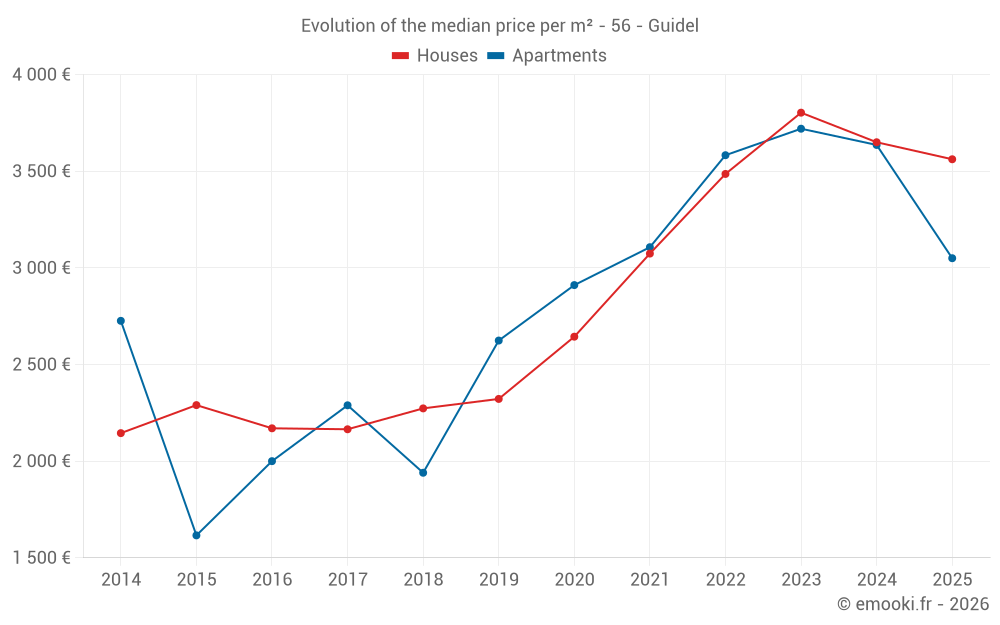
Median price of real estate
in the municipality of Guidel

HousesHouses
3 562  /m²
1-23-45-67-89-10
Reliability 9/10
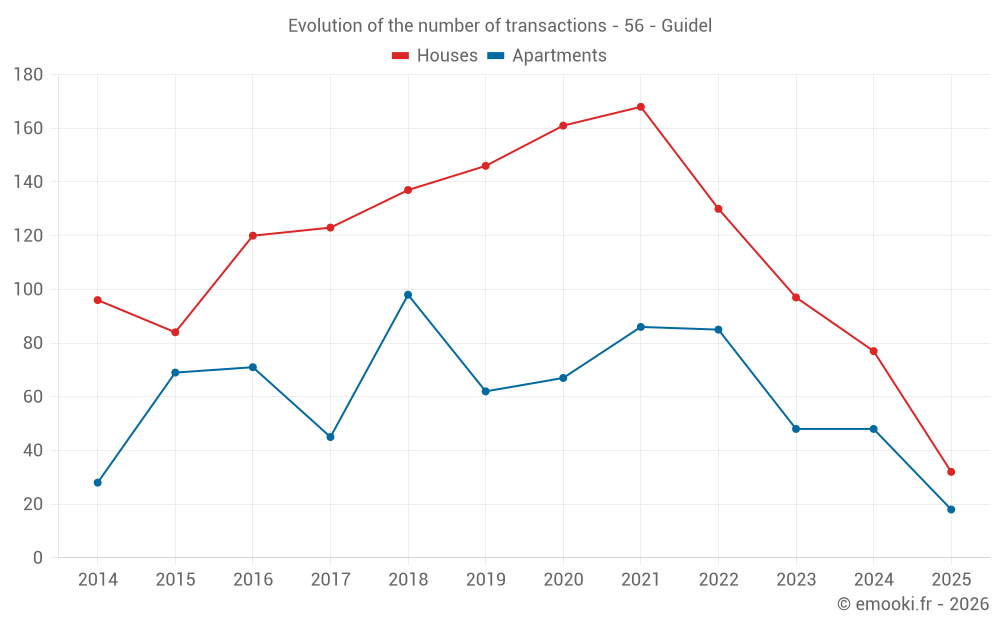
Median price on the 32 transactions of the last 6 months.
from 2 778 to
4 922  /m²
60% of transactions from the 2nd to the 8th deciles.
ApartmentsApartments
3 050  /m²
1-23-45-67-89-10
Reliability 9/10
Median price on the 18 transactions of the last 6 months.
from 2 223 to
4 434  /m²
60% of transactions from the 2nd to the 8th deciles.
DwellingsDwellings
3 180  /m²
1-23-45-67-89-10
Reliability 10/10
Median price on the 24 transactions of the last 3 months.
from 2 348 to
4 270  /m²
60% of transactions from the 2nd to the 8th deciles.
HousesEvolution of the price per m² of houses since...
1 year
-2.4%
2 years
-6.3%
3 years
+2.2%
4 years
+16%
5 years
+35%
6 years
+53%
7 years
+57%
8 years
+65%
9 years
+64%
10 years
+56%
11 years
+66%
The price per m² of houses has decreased by 6.3% since 2 years, but it has increased by 66% in 11 years.
ApartmentsEvolution of the price per m² of apartments since...
1 year
-16%
2 years
-18%
3 years
-15%
4 years
-1.8%
5 years
+4.8%
6 years
+16%
7 years
+57%
8 years
+33%
9 years
+52%
10 years
+89%
11 years
+12%
The price per m² of apartments has decreased by 18% since 2 years, but it has increased by 89% in 10 years.

Yearly evolution

Evolution of the median price per m²

Evolution of the median price per m² - 56 - Guidel

Evolution of the number of transactions

Warning, last year incomplete. Projections made based on the proportions between semesters of the previous year at the departmental/national level and by type of property.

Evolution of the number of transactions - 56 - Guidel

Yearly data

Descending order
Year
Houses
house
transactions
Houses
house
Price per m²
Apartments
apt.
transactions
Apartments
apt.
Price per m²
2025
32
3 562 
18
3 050 
2024
77
3 650 
48
3 636 
2023
97
3 803 
48
3 720 
2022
130
3 486 
85
3 583 
2021
168
3 074 
86
3 107 
2020
161
2 644 
67
2 911 
2019
146
2 322 
62
2 624 
2018
137
2 273 
98
1 940 
2017
123
2 165 
45
2 289 
2016
120
2 170 
71
2 000 
2015
84
2 290 
69
1 616 
2014
96
2 145 
28
2 726 

Analysis

Structure of prices per m²

Values of price percentiles per m² over the periods used for the estimated price of each type of property.

Structure of transaction amounts

Values of transaction amounts percentiles over the periods used for the estimated price of each type of property.

Transaction amounts and prices per m² by percentile

Ascending order
Percentile
Houses
house
Price per m²
Houses
house
Transaction amount
Apartments
apt.
Price per m²
Apartments
apt.
Transaction amount
10th percentile
2 330 
153 K
1 721 
99 966 
20th percentile
2 778 
196 K
2 223 
118 K
30th percentile
3 079 
239 K
2 333 
122 K
40th percentile
3 357 
294 K
2 387 
135 K
50th percentile
3 562 
313 K
3 050 
153 K
60th percentile
3 946 
369 K
3 325 
173 K
70th percentile
4 002 
387 K
4 049 
216 K
80th percentile
4 922 
424 K
4 434 
237 K
90th percentile
5 359 
544 K
4 769 
265 K

National and departmental comparison

Evolution of the median price per m² of houses

Evolution of the median price per m² of apartments

Quarterly evolution

Evolution of the median price per m²

Evolution of the number of transactions

Quarterly data

Descending order
Quarter
Houses
house
transactions
Houses
house
Price per m²
Apartments
apt.
transactions
Apartments
apt.
Price per m²
2025 Q2
14
3 334 
10
2 656 
2025 Q1
18
3 941 
8
3 526 
2024 Q4
18
3 322 
12
3 025 
2024 Q3
32
3 958 
8
3 638 
2024 Q2
17
3 417 
18
4 144 
2024 Q1
10
3 223 
10
3 442 
2023 Q4
27
4 188 
7
3 611 
2023 Q3
22
3 748 
10
3 848 
2023 Q2
16
3 744 
15
3 662 
2023 Q1
32
3 727 
16
3 866 
2022 Q4
30
3 431 
16
3 736 
2022 Q3
39
3 566 
21
3 636 
2022 Q2
35
3 479 
21
3 594 
2022 Q1
26
3 529 
27
3 344 
2021 Q4
40
3 228 
25
3 027 
2021 Q3
49
3 165 
30
3 190 
2021 Q2
44
3 002 
16
3 144 
2021 Q1
35
3 011 
15
2 894 
2020 Q4
55
2 697 
17
2 350 
2020 Q3
31
2 549 
15
2 813 
2020 Q2
35
2 800 
22
2 986 
2020 Q1
40
2 404 
13
3 145 
2019 Q4
23
2 478 
15
2 214 
2019 Q3
51
2 318 
13
2 769 
2019 Q2
42
2 348 
17
2 896 
2019 Q1
30
2 195 
17
2 422 
2018 Q4
37
2 208 
22
2 425 
2018 Q3
39
2 404 
20
2 139 
2018 Q2
30
2 260 
32
1 860 
2018 Q1
31
2 115 
24
1 782 
2017 Q4
32
1 904 
10
2 187 
2017 Q3
30
2 250 
9
2 174 
2017 Q2
32
2 222 
11
2 353 
2017 Q1
29
2 340 
15
2 381 
2016 Q4
32
2 146 
22
2 430 
2016 Q3
39
2 157 
12
1 698 
2016 Q2
26
2 075 
21
2 172 
2016 Q1
23
2 330 
16
1 612 
2015 Q4
20
1 992 
25
1 653 
2015 Q3
18
2 462 
17
1 616 
2015 Q2
29
2 213 
15
1 593 
2015 Q1
17
2 324 
12
1 518 
2014 Q4
22
1 967 
7
2 809 
2014 Q3
22
2 145 
11
2 642 
2014 Q2
32
2 289 
3
3 789 
2014 Q1
20
2 040 
7
2 532 

Overview of the latest real estate transactions

The following list is an anonymized overview of the latest transactions. For more details and to find all transactions, please use the map to view transactions by plot or the transaction search page for a search by criteria.

2025-06-14
157 730 
2 390  /m²(66 m²)
Sale
Apartments
Apartment
3 rooms
66 m2
1 outbuilding
2025-06-11
60 000 
Sale
Land
1668 m2
-Terrains d'agrément
2025-06-06
260 000 
2 549  /m²(102 m²)
Sale
Houses
House
5 rooms
102 m2
Land
256 m2
-Sols
2025-06-05
135 000 
1 929  /m²(70 m²)
Sale
Apartments
Apartment
2 rooms
70 m2
Land
97 m2
-Sols
2025-06-04
361 397 
Sale
Land
9989 m2
-Prés
Land
720 m2
-Prés
2025-06-03
210 377 
679  /m²(310 m²)
Sale
Apartments
Apartment
2 rooms
30 m2
Apartments
Apartment
2 rooms
30 m2
Apartments
Apartment
3 rooms
60 m2
Apartments
Apartment
1 room
130 m2
Apartments
Apartment
2 rooms
30 m2
Apartments
Apartment
2 rooms
30 m2
Land
562 m2
-Sols
2025-06-03
119 780 
2 921  /m²(41 m²)
Sale
Apartments
Apartment
2 rooms
41 m2
2025-06-02
300 000 
265  /m²(1134 m²)
2 586  /m²(116 m²)
Sale
Land
22 m2
-Sols
Land
55 m2
-Sols
Land
145 m2
-Sols
Houses
House
3 rooms
58 m2
Land
285 m2
-Sols
Commercial property
458 m2
3 outbuildings
Land
739 m2
-Sols
Apartments
Apartment
2 rooms
58 m2
Commercial property
560 m2
Land
22 m2
-Sols
Land
1764 m2
-Sols
2025-05-28
300 000 
3 409  /m²(88 m²)
Sale
Houses
House
4 rooms
88 m2
Land
558 m2
-Sols
2025-05-28
82 500 
2 230  /m²(37 m²)
Sale
Apartments
Apartment
2 rooms
37 m2
2 outbuildings
Land
575 m2
-Prés
Land
945 m2
-Terres
Land
1200 m2
-Sols
2025-05-28
400 000 
1 050  /m²(381 m²)
Sale
Commercial property
381 m2
Land
2796 m2
-Sols
2025-05-27
1 
Sale
Land
8 m2
-Sols
2025-05-19
548 000 
4 315  /m²(127 m²)
Sale
Houses
House
4 rooms
127 m2
Land
731 m2
-Sols
2025-04-30
375 120 
3 441  /m²(109 m²)
Sale
Houses
House
5 rooms
109 m2
Land
469 m2
-Sols
2025-04-30
84 790 
4 240  /m²(20 m²)
Sale
Apartments
Apartment
1 room
20 m2
1 outbuilding
2025-04-30
148 000 
4 625  /m²(32 m²)
Sale
Apartments
Apartment
2 rooms
32 m2
2025-04-30
182 000 
Sale
Land
279 m2
-Terrains à bâtir
Land
69 m2
-Terrains à bâtir
2025-04-30
180 000 
Sale
Land
389 m2
-Terrains d'agrément
2025-04-30
178 000 
Sale
Land
317 m2
-Sols
2025-04-29
360 200 
3 002  /m²(120 m²)
Sale
Houses
House
5 rooms
120 m2
1 outbuilding
Land
324 m2
-Sols
Land
1681 m2
-Terrains d'agrément
Land
457 m2
-Jardins
Land
128 m2
-Terrains d'agrément
Land
940 m2
-Terrains d'agrément
3239 transactions listed in the municipality

Morbihan (56)

Most expensive cities

City
name
Descending orderHouses
house
Price per m²
6 560 
5 843 
5 741 
5 625 
5 440 
5 366 
5 319 
5 302 
5 112 
City
name
Descending orderApartments
apt.
Price per m²
6 879 
5 986 
5 736 
5 232 
5 000 
4 948 
4 613 

Least expensive cities

City
name
Ascending orderHouses
house
Price per m²
747 
788 
904 
920 
921 
949 
1 020 
City
name
Ascending orderApartments
apt.
Price per m²
167 
325 
368 
388 
417 
430 
432 
458 
475 
482