emooki
HomePrice mapTransactions
🇬🇧 English🇫🇷 Français🇩🇪 Deutsch🇪🇸 Español🇮🇹 Italiano

Real estate price map


Real estate price map in the municipality of Cosnes-et-Romain, choose a section to see transactions by parcel.

Meurthe-et-Moselle (54)

Cosnes-et-Romain - Real estate price m²

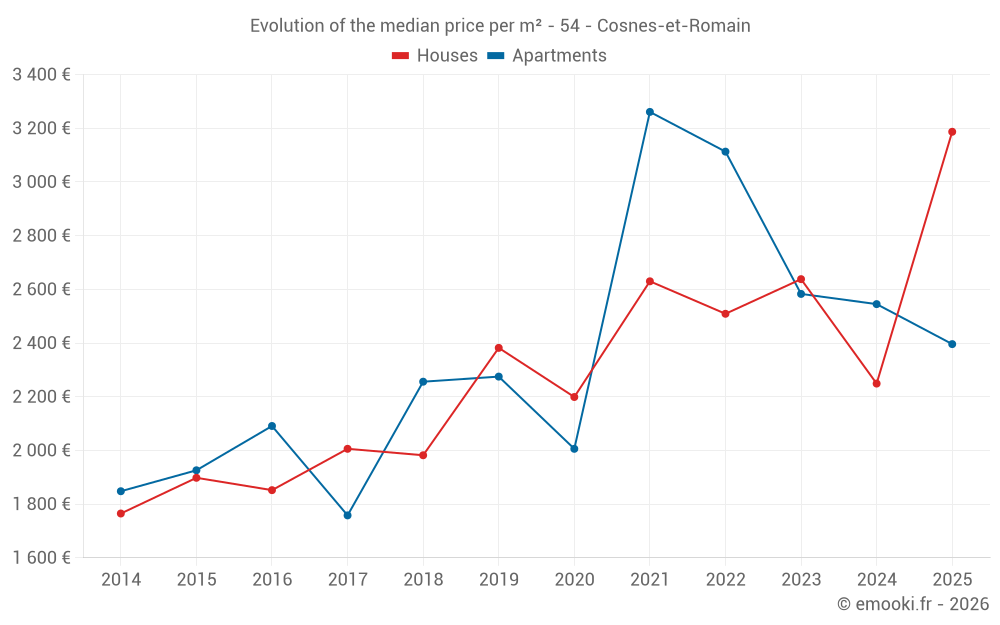
Median price of real estate
in the municipality of Cosnes-et-Romain

HousesHouses
2 724  /m²
1-23-45-67-89-10
Reliability 8/10
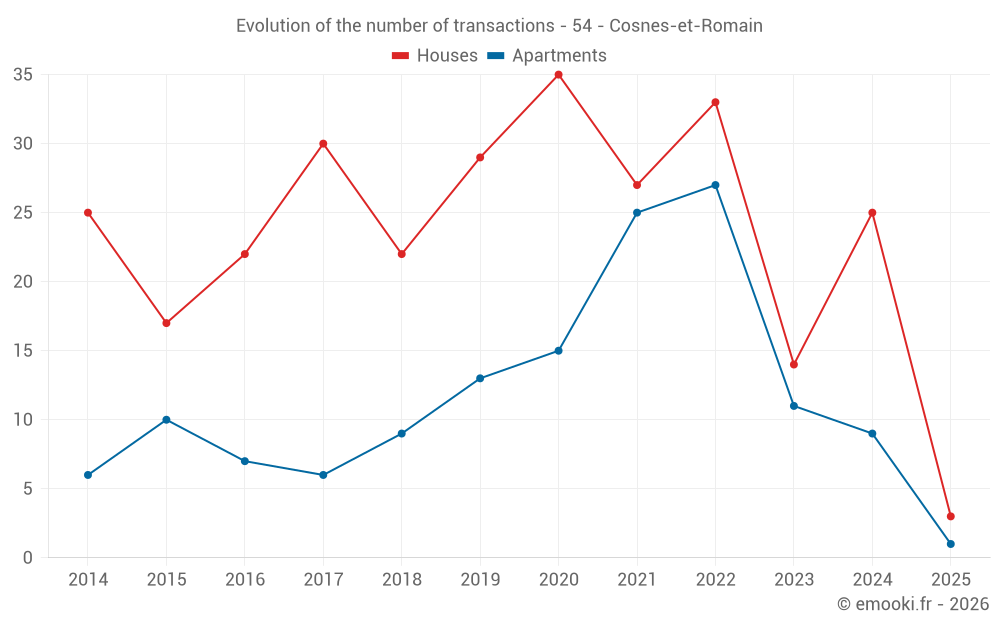
Median price on the 19 transactions of the last 12 months.
from 1 979 to
3 263  /m²
60% of transactions from the 2nd to the 8th deciles.
ApartmentsApartments
2 558  /m²
1-23-45-67-89-10
Reliability 7/10
Median price on the 14 transactions of the last 24 months.
from 2 382 to
3 320  /m²
60% of transactions from the 2nd to the 8th deciles.
DwellingsDwellings
2 577  /m²
1-23-45-67-89-10
Reliability 8/10
Median price on the 23 transactions of the last 12 months.
from 2 062 to
3 120  /m²
60% of transactions from the 2nd to the 8th deciles.

Yearly evolution

Evolution of the median price per m²

Evolution of the median price per m² - 54 - Cosnes-et-Romain

Evolution of the number of transactions

Warning, last year incomplete. Projections made based on the proportions between semesters of the previous year at the departmental/national level and by type of property.

Evolution of the number of transactions - 54 - Cosnes-et-Romain

Yearly data

Descending order
Year
Houses
house
transactions
Houses
house
Price per m²
Apartments
apt.
transactions
Apartments
apt.
Price per m²
2025
3
3 187 
1
2 396 
2024
25
2 249 
9
2 545 
2023
14
2 638 
11
2 583 
2022
33
2 509 
27
3 113 
2021
27
2 630 
25
3 261 
2020
35
2 199 
15
2 006 
2019
29
2 382 
13
2 275 
2018
22
1 982 
9
2 256 
2017
30
2 006 
6
1 758 
2016
22
1 852 
7
2 091 
2015
17
1 898 
10
1 926 
2014
25
1 765 
6
1 848 

Analysis

Structure of prices per m²

Values of price percentiles per m² over the periods used for the estimated price of each type of property.

Structure of transaction amounts

Values of transaction amounts percentiles over the periods used for the estimated price of each type of property.

Transaction amounts and prices per m² by percentile

Ascending order
Percentile
Houses
house
Price per m²
Houses
house
Transaction amount
Apartments
apt.
Price per m²
Apartments
apt.
Transaction amount
10th percentile
1 674 
134 K
2 249 
118 K
20th percentile
1 979 
172 K
2 382 
125 K
30th percentile
2 166 
227 K
2 447 
131 K
40th percentile
2 515 
256 K
2 471 
155 K
50th percentile
2 724 
260 K
2 558 
165 K
60th percentile
2 884 
298 K
2 588 
188 K
70th percentile
2 979 
313 K
2 787 
210 K
80th percentile
3 263 
347 K
3 320 
225 K
90th percentile
3 387 
423 K
3 762 
279 K

National and departmental comparison

Evolution of the median price per m² of houses

Evolution of the median price per m² of apartments

Quarterly evolution

Evolution of the median price per m²

Evolution of the number of transactions

Quarterly data

Descending order
Quarter
Houses
house
transactions
Houses
house
Price per m²
Apartments
apt.
transactions
Apartments
apt.
Price per m²
2025 Q2
2
2 204 
0
--- 
2025 Q1
1
3 665 
1
2 396 
2024 Q4
8
2 704 
1
2 201 
2024 Q3
8
2 650 
2
2 568 
2024 Q2
7
1 611 
4
2 512 
2024 Q1
2
2 188 
2
2 766 
2023 Q4
3
2 641 
2
3 276 
2023 Q3
3
3 456 
2
3 152 
2023 Q2
4
1 961 
5
2 583 
2023 Q1
4
1 850 
2
1 442 
2022 Q4
7
2 990 
5
2 559 
2022 Q3
8
3 434 
10
3 266 
2022 Q2
12
2 324 
7
3 088 
2022 Q1
6
2 216 
5
3 475 
2021 Q4
5
3 107 
10
3 342 
2021 Q3
9
2 738 
9
3 430 
2021 Q2
7
2 294 
4
2 191 
2021 Q1
6
2 430 
2
1 905 
2020 Q4
8
2 088 
8
2 028 
2020 Q3
11
1 910 
3
2 363 
2020 Q2
10
2 262 
4
1 916 
2020 Q1
6
2 535 
0
--- 
2019 Q4
8
2 450 
1
2 720 
2019 Q3
10
2 598 
2
1 866 
2019 Q2
9
1 670 
8
2 273 
2019 Q1
2
1 466 
2
2 438 
2018 Q4
4
2 447 
0
--- 
2018 Q3
5
1 582 
3
2 205 
2018 Q2
7
1 977 
0
--- 
2018 Q1
6
1 912 
6
2 270 
2017 Q4
9
2 209 
1
1 250 
2017 Q3
12
1 934 
1
1 563 
2017 Q2
4
1 285 
3
1 953 
2017 Q1
5
2 000 
1
2 408 
2016 Q4
7
2 235 
0
--- 
2016 Q3
7
1 953 
2
2 058 
2016 Q2
3
1 752 
1
2 178 
2016 Q1
5
1 357 
4
2 038 
2015 Q4
4
2 002 
1
1 889 
2015 Q3
5
1 974 
4
1 832 
2015 Q2
5
1 842 
4
1 823 
2015 Q1
3
1 141 
1
2 006 
2014 Q4
8
1 894 
2
2 000 
2014 Q3
5
957 
2
1 833 
2014 Q2
6
1 895 
0
--- 
2014 Q1
6
1 692 
2
1 472 

Overview of the latest real estate transactions

The following list is an anonymized overview of the latest transactions. For more details and to find all transactions, please use the map to view transactions by plot or the transaction search page for a search by criteria.

2025-06-20
110 000 
1 222  /m²(90 m²)
Sale
Houses
House
4 rooms
90 m2
1 outbuilding
Land
619 m2
-Sols
2025-06-12
341 000 
3 187  /m²(107 m²)
Sale
Houses
House
4 rooms
107 m2
Land
584 m2
-Prés
Land
583 m2
-Jardins
Land
534 m2
-Sols
Land
583 m2
-Vergers
2025-06-02
132 000 
transaction.nature.Vente terrain à bâtir
Land
892 m2
-Terrains à bâtir
2025-05-28
120 000 
transaction.nature.Vente terrain à bâtir
Land
901 m2
-Terrains à bâtir
2025-05-28
80 000 
920  /m²(87 m²)
Sale
Commercial property
87 m2
2025-04-14
1 200 
Sale
Land
645 m2
-Prés
Land
4450 m2
-Taillis sous futaie
2025-03-27
590 000 
3 665  /m²(161 m²)
Sale
Houses
House
4 rooms
161 m2
Land
665 m2
-Sols
2025-03-26
213 325 
Sale
Land
113 m2
-Sols
Land
1023 m2
-Terrains à bâtir
Land
383 m2
-Sols
Land
1026 m2
-Terrains à bâtir
Land
767 m2
-Sols
Land
1778 m2
-Terrains à bâtir
2025-03-26
80 000 
Sale
Land
1240 m2
-Terres
2025-03-21
315 000 
1 981  /m²(159 m²)
12 600  /m²(25 m²)
Sale
Houses
House
1 room
25 m2
Commercial property
134 m2
Land
375 m2
-Sols
2025-03-06
535 000 
Sale
Land
2962 m2
-Terrains à bâtir
Land
3696 m2
-Landes
/Friche
Land
1500 m2
-Terrains à bâtir
2025-02-28
232 500 
Sale
Land
681 m2
-Prés
Land
310 m2
-Jardins
Land
330 m2
-Jardins
Land
660 m2
-Prés
2025-02-25
115 000 
2 396  /m²(48 m²)
Sale
Apartments
Apartment
1 room
48 m2
2025-01-25
5 000 
Sale
Land
320 m2
-Jardins
2024-12-30
22 500 
409  /m²(55 m²)
Sale
Houses
House
2 rooms
55 m2
Land
164 m2
-Sols
2024-12-24
209 100 
2 201  /m²(95 m²)
Sale
Apartments
Apartment
3 rooms
95 m2
4 outbuildings
2024-12-16
99 000 
Sale
Land
686 m2
-Terrains à bâtir
Land
57 m2
-Terrains à bâtir
2024-12-11
320 000 
3 019  /m²(106 m²)
Sale
Houses
House
6 rooms
106 m2
Land
405 m2
-Sols
2024-11-25
2 900 
Sale
Land
56 m2
-Terrains d'agrément
2024-11-13
720 000 
Sale
Land
5163 m2
-Sols
Land
180 m2
-Sols
683 transactions listed in the municipality

Meurthe-et-Moselle (54)

Most expensive cities

City
name
Descending orderHouses
house
Price per m²
3 544 
3 090 
2 984 
2 863 
2 824 
2 754 
2 724 
2 659 
2 633 
City
name
Descending orderApartments
apt.
Price per m²
3 571 
3 344 
2 819 
2 644 
2 641 
2 614 
2 558 
2 458 

Least expensive cities

City
name
Ascending orderHouses
house
Price per m²
259 
280 
320 
395 
412 
448 
448 
468 
City
name
Ascending orderApartments
apt.
Price per m²
157 
167 
169 
169 
245 
247 
261