emooki
HomePrice mapTransactions
🇬🇧 English🇫🇷 Français🇩🇪 Deutsch🇪🇸 Español🇮🇹 Italiano

Real estate price map


Real estate price map in the municipality of Landres, choose a section to see transactions by parcel.

Meurthe-et-Moselle (54)

Landres - Real estate price m²

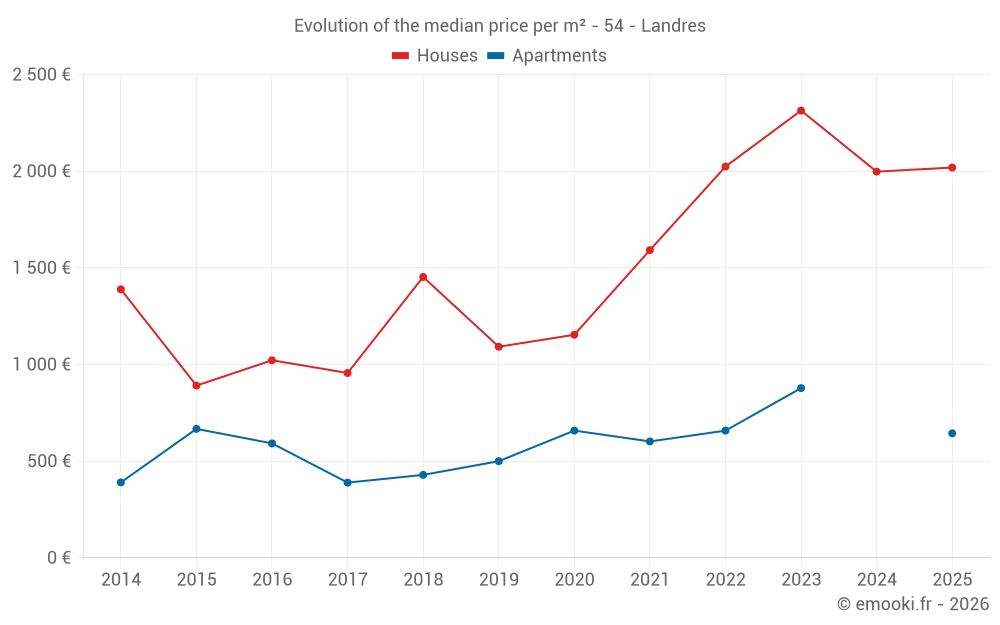
Median price of real estate
in the municipality of Landres

HousesHouses
2 312  /m²
1-23-45-67-89-10
Reliability 7/10
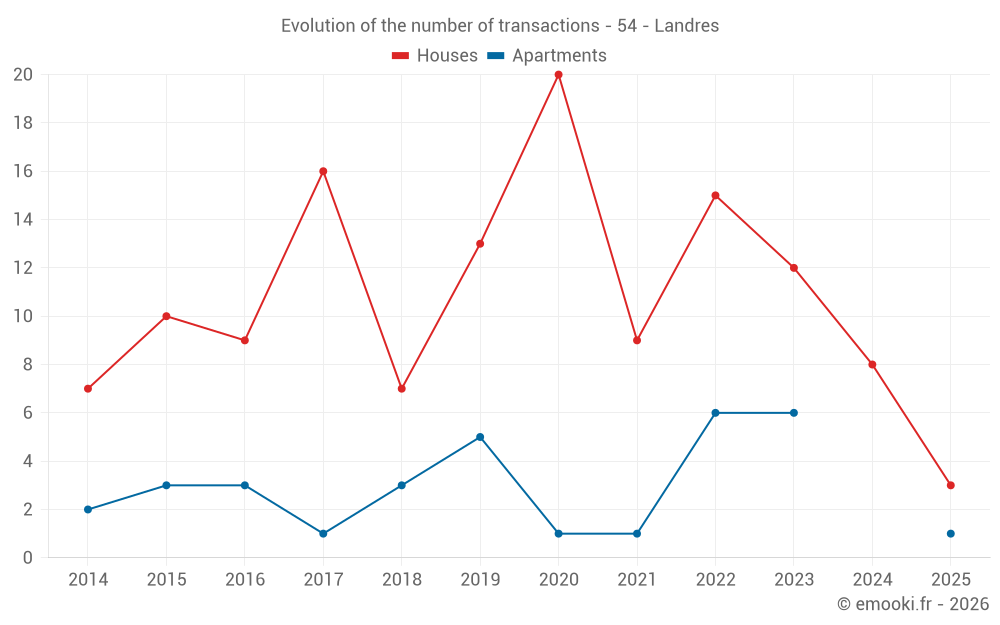
Median price on the 18 transactions of the last 24 months.
from 1 582 to
2 552  /m²
60% of transactions from the 2nd to the 8th deciles.
ApartmentsApartments
703  /m²
1-23-45-67-89-10
Reliability 5/10
Median price on the 13 transactions of the last 48 months.
from 554 to
878  /m²
60% of transactions from the 2nd to the 8th deciles.
DwellingsDwellings
2 019  /m²
1-23-45-67-89-10
Reliability 7/10
Median price on the 23 transactions of the last 24 months.
from 1 125 to
2 501  /m²
60% of transactions from the 2nd to the 8th deciles.

Yearly evolution

Evolution of the median price per m²

Evolution of the median price per m² - 54 - Landres

Evolution of the number of transactions

Warning, last year incomplete. Projections made based on the proportions between semesters of the previous year at the departmental/national level and by type of property.

Evolution of the number of transactions - 54 - Landres

Yearly data

Descending order
Year
Houses
house
transactions
Houses
house
Price per m²
Apartments
apt.
transactions
Apartments
apt.
Price per m²
2025
3
2 019 
1
644 
2024
8
1 998 
0
--- 
2023
12
2 314 
6
878 
2022
15
2 024 
6
658 
2021
9
1 592 
1
602 
2020
20
1 154 
1
658 
2019
13
1 092 
5
500 
2018
7
1 453 
3
429 
2017
16
956 
1
389 
2016
9
1 022 
3
592 
2015
10
891 
3
667 
2014
7
1 389 
2
390 

Analysis

Structure of prices per m²

Values of price percentiles per m² over the periods used for the estimated price of each type of property.

Structure of transaction amounts

Values of transaction amounts percentiles over the periods used for the estimated price of each type of property.

Transaction amounts and prices per m² by percentile

Ascending order
Percentile
Houses
house
Price per m²
Houses
house
Transaction amount
Apartments
apt.
Price per m²
Apartments
apt.
Transaction amount
10th percentile
1 527 
146 K
495 
25 200 
20th percentile
1 582 
181 K
554 
30 000 
30th percentile
1 790 
195 K
612 
31 800 
40th percentile
2 188 
202 K
638 
42 600 
50th percentile
2 312 
215 K
703 
58 000 
60th percentile
2 383 
228 K
817 
68 480 
70th percentile
2 490 
245 K
844 
76 000 
80th percentile
2 552 
269 K
878 
79 000 
90th percentile
2 675 
278 K
930 
129 K

National and departmental comparison

Evolution of the median price per m² of houses

Evolution of the median price per m² of apartments

Quarterly evolution

Evolution of the median price per m²

Evolution of the number of transactions

Quarterly data

Descending order
Quarter
Houses
house
transactions
Houses
house
Price per m²
Apartments
apt.
transactions
Apartments
apt.
Price per m²
2025 Q2
1
2 600 
1
644 
2025 Q1
2
1 822 
0
--- 
2024 Q4
3
2 368 
0
--- 
2024 Q3
2
2 202 
0
--- 
2024 Q2
3
1 765 
0
--- 
2023 Q4
1
2 496 
2
697 
2023 Q3
6
2 402 
2
745 
2023 Q2
2
1 736 
2
996 
2023 Q1
3
2 185 
0
--- 
2022 Q4
7
1 790 
1
816 
2022 Q3
4
1 846 
1
286 
2022 Q2
2
2 664 
1
703 
2022 Q1
2
2 336 
3
612 
2021 Q4
1
1 305 
0
--- 
2021 Q3
4
1 541 
0
--- 
2021 Q2
1
483 
1
602 
2021 Q1
3
1 854 
0
--- 
2020 Q4
6
1 216 
1
658 
2020 Q3
8
1 154 
0
--- 
2020 Q2
2
958 
0
--- 
2020 Q1
4
696 
0
--- 
2019 Q4
2
1 321 
0
--- 
2019 Q3
4
1 728 
1
391 
2019 Q2
4
1 072 
2
549 
2019 Q1
3
979 
2
478 
2018 Q4
1
1 389 
2
455 
2018 Q3
1
980 
0
--- 
2018 Q2
4
1 604 
0
--- 
2018 Q1
1
1 453 
1
429 
2017 Q4
5
559 
1
389 
2017 Q3
7
990 
0
--- 
2017 Q2
4
596 
0
--- 
2016 Q4
4
1 242 
1
735 
2016 Q3
3
929 
1
592 
2016 Q2
2
1 079 
1
469 
2015 Q4
1
380 
1
789 
2015 Q3
1
1 071 
2
568 
2015 Q2
5
644 
0
--- 
2015 Q1
3
1 323 
0
--- 
2014 Q4
1
1 177 
0
--- 
2014 Q3
4
1 558 
1
422 
2014 Q2
2
1 126 
1
359 

Overview of the latest real estate transactions

The following list is an anonymized overview of the latest transactions. For more details and to find all transactions, please use the map to view transactions by plot or the transaction search page for a search by criteria.

2025-06-03
58 000 
644  /m²(90 m²)
Sale
Apartments
Apartment
5 rooms
90 m2
1 outbuilding
2025-05-14
247 000 
2 600  /m²(95 m²)
Sale
Houses
House
3 rooms
95 m2
Land
267 m2
-Vergers
2025-05-12
83 500 
938  /m²(89 m²)
Sale
Commercial property
89 m2
Land
633 m2
-Sols
2025-03-10
229 000 
1 624  /m²(141 m²)
Sale
Houses
House
3 rooms
141 m2
Land
530 m2
-Sols
2025-03-03
272 500 
2 019  /m²(135 m²)
Sale
Houses
House
7 rooms
135 m2
1 outbuilding
Land
1000 m2
-Sols
Land
520 m2
-Jardins
2024-12-10
200 000 
1 538  /m²(130 m²)
Sale
Houses
House
6 rooms
130 m2
3 outbuildings
Land
865 m2
-Sols
2024-11-08
227 310 
2 368  /m²(96 m²)
Sale
Houses
House
5 rooms
96 m2
Land
339 m2
-Sols
2024-10-28
270 500 
2 505  /m²(108 m²)
Sale
Houses
House
5 rooms
108 m2
1 outbuilding
Land
418 m2
-Sols
Land
850 m2
-Jardins
2024-10-23
5 000 
Sale
Land
260 m2
-Sols
Land
63 m2
-Sols
2024-08-14
202 000 
1 554  /m²(130 m²)
Sale
Houses
House
5 rooms
130 m2
Land
251 m2
-Sols
Land
171 m2
-Sols
2024-07-29
228 000 
2 850  /m²(80 m²)
Sale
Houses
House
4 rooms
80 m2
1 outbuilding
Land
618 m2
-Sols
1 outbuilding
Land
16 m2
-Sols
Land
1118 m2
-Sols
Land
88 m2
-Landes
/Friche
2024-06-25
272 000 
Sale
Land
527 m2
-Sols
2024-06-11
194 000 
2 230  /m²(87 m²)
Sale
Houses
House
4 rooms
87 m2
2 outbuildings
Land
730 m2
-Sols
1 outbuilding
Land
20 m2
-Sols
Land
147 m2
-Sols
2024-05-07
37 000 
Sale
Land
600 m2
-Jardins
2024-04-22
120 000 
1 765  /m²(68 m²)
Sale
Houses
House
3 rooms
68 m2
Land
310 m2
-Sols
2024-04-05
120 000 
1 500  /m²(80 m²)
Sale
Houses
House
4 rooms
80 m2
2 outbuildings
Land
576 m2
-Sols
Land
150 m2
-Landes
/Friche
Land
179 m2
-Landes
/Friche
2024-03-12
43 000 
473  /m²(91 m²)
Auction
Apartments
Apartment
4 rooms
91 m2
3 outbuildings
Land
17 m2
-Sols
Land
700 m2
-Jardins
Land
250 m2
-Sols
Land
211 m2
-Sols
2023-11-27
33 000 
516  /m²(64 m²)
Sale
1 outbuilding
Apartments
Apartment
3 rooms
64 m2
1 outbuilding
2023-11-02
55 000 
873  /m²(63 m²)
Sale
Commercial property
63 m2
2023-10-25
3 000 
Sale
1 outbuilding
Land
17 m2
-Sols
248 transactions listed in the municipality

Meurthe-et-Moselle (54)

Most expensive cities

City
name
Descending orderHouses
house
Price per m²
3 544 
3 090 
2 984 
2 863 
2 824 
2 754 
2 724 
2 659 
2 633 
City
name
Descending orderApartments
apt.
Price per m²
3 571 
3 344 
2 819 
2 644 
2 641 
2 614 
2 558 
2 458 

Least expensive cities

City
name
Ascending orderHouses
house
Price per m²
259 
280 
320 
395 
412 
448 
448 
468 
City
name
Ascending orderApartments
apt.
Price per m²
157 
167 
169 
169 
245 
247 
261