emooki
HomePrice mapTransactions
🇬🇧 English🇫🇷 Français🇩🇪 Deutsch🇪🇸 Español🇮🇹 Italiano

Real estate price map


Real estate price map in the municipality of Renazé.

Mayenne (53)
Renazé

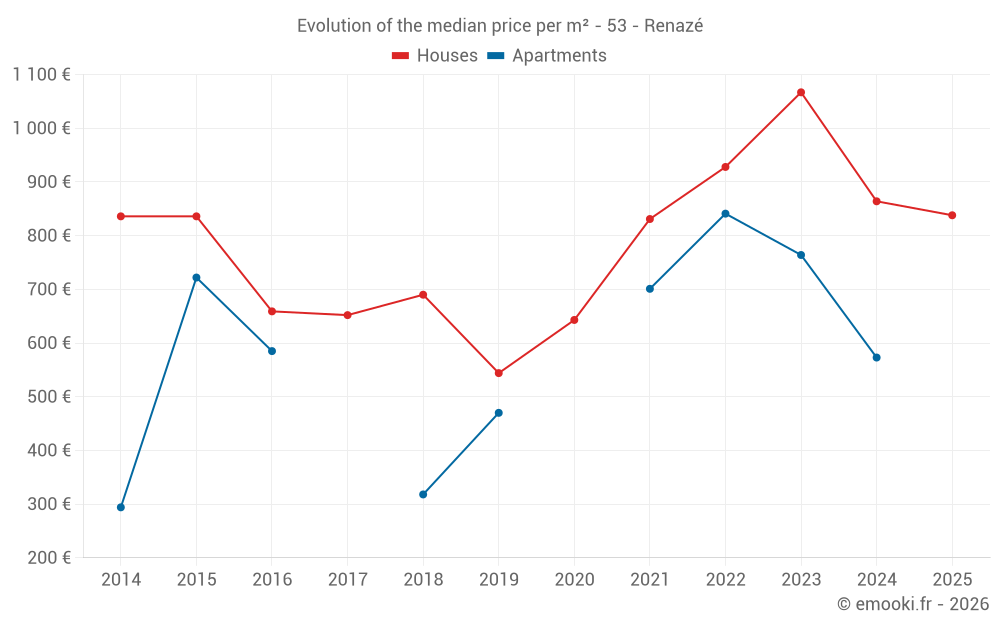
Median price of real estate
in the municipality of Renazé

HousesHouses
883  /m²
1-23-45-67-89-10
Reliability 8/10
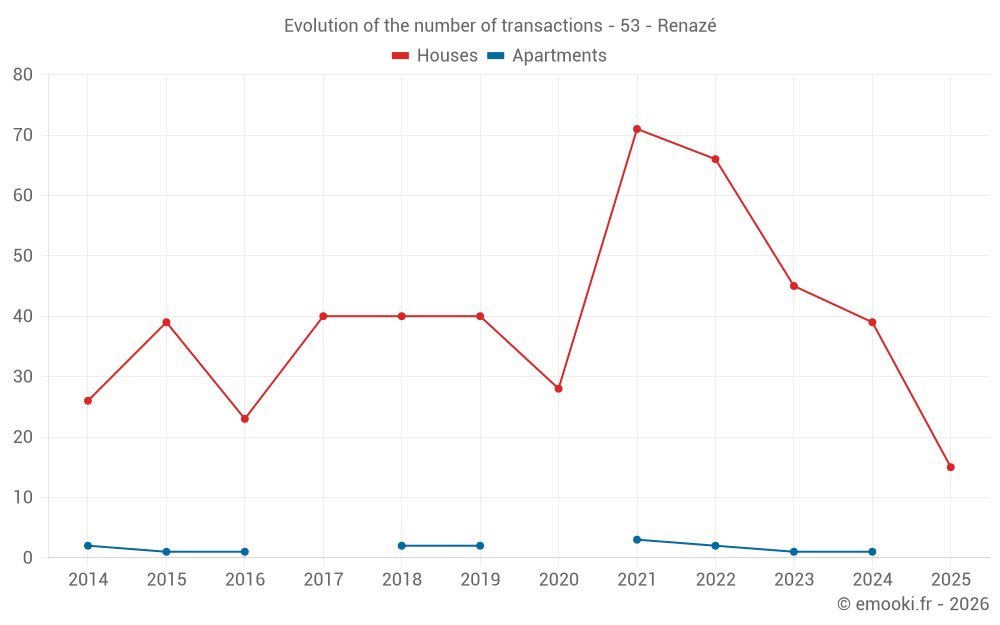
Median price on the 40 transactions of the last 12 months.
from 675 to
1 280  /m²
60% of transactions from the 2nd to the 8th deciles.
ApartmentsApartments
724  /m²
1-23-45-67-89-10
Reliability 3/10
Median price on the 8 transactions of the last 72 months.
DwellingsDwellings
875  /m²
1-23-45-67-89-10
Reliability 8/10
Median price on the 41 transactions of the last 12 months.
from 662 to
1 266  /m²
60% of transactions from the 2nd to the 8th deciles.
HousesEvolution of the price per m² of houses since...
1 year
-3%
2 years
-21%
3 years
-10%
4 years
+0.8%
5 years
+30%
6 years
+54%
7 years
+21%
8 years
+29%
9 years
+27%
10 years
+0.2%
11 years
+0.2%
ApartmentsEvolution of the price per m² of apartments since...
1 year
--
2 years
--
3 years
--
4 years
--
5 years
--
6 years
--
7 years
--
8 years
--
9 years
--
10 years
--
11 years
--

Yearly evolution

Evolution of the median price per m²

Evolution of the number of transactions

Warning, last year incomplete. Projections made based on the proportions between semesters of the previous year at the departmental/national level and by type of property.

Yearly data

Descending order
Year
Houses
house
transactions
Houses
house
Price per m²
Apartments
apt.
transactions
Apartments
apt.
Price per m²
2025
15
838 
0
--- 
2024
39
864 
1
573 
2023
45
1 067 
1
764 
2022
66
928 
2
841 
2021
71
831 
3
701 
2020
28
643 
0
--- 
2019
40
544 
2
470 
2018
40
690 
2
318 
2017
40
652 
0
--- 
2016
23
659 
1
585 
2015
39
836 
1
722 
2014
26
836 
2
294 

Analysis

Structure of prices per m²

Values of price percentiles per m² over the periods used for the estimated price of each type of property.

Structure of transaction amounts

Values of transaction amounts percentiles over the periods used for the estimated price of each type of property.

Transaction amounts and prices per m² by percentile

Ascending order
Percentile
Houses
house
Price per m²
Houses
house
Transaction amount
Apartments
apt.
Price per m²
Apartments
apt.
Transaction amount
10th percentile
560 
40 900 
588 
62 248 
20th percentile
675 
49 052 
601 
67 800 
30th percentile
758 
63 700 
620 
78 500 
40th percentile
819 
70 000 
683 
103 K
50th percentile
883 
81 250 
724 
118 K
60th percentile
980 
93 500 
751 
132 K
70th percentile
1 178 
102 K
762 
157 K
80th percentile
1 280 
127 K
912 
210 K
90th percentile
1 508 
172 K
1 028 
271 K

National and departmental comparison

Evolution of the median price per m² of houses

Evolution of the median price per m² of apartments

Quarterly evolution

Evolution of the median price per m²

Evolution of the number of transactions

Quarterly data

Descending order
Quarter
Houses
house
transactions
Houses
house
Price per m²
Apartments
apt.
transactions
Apartments
apt.
Price per m²
2025 Q2
6
785 
0
--- 
2025 Q1
9
962 
0
--- 
2024 Q4
15
831 
1
573 
2024 Q3
10
1 168 
0
--- 
2024 Q2
9
781 
0
--- 
2024 Q1
5
846 
0
--- 
2023 Q4
13
1 023 
0
--- 
2023 Q3
15
1 167 
1
764 
2023 Q2
12
1 124 
0
--- 
2023 Q1
5
972 
0
--- 
2022 Q4
14
1 132 
0
--- 
2022 Q3
19
946 
1
611 
2022 Q2
18
1 164 
0
--- 
2022 Q1
15
429 
1
1 071 
2021 Q4
19
942 
1
1 010 
2021 Q3
18
1 043 
1
701 
2021 Q2
18
556 
0
--- 
2021 Q1
16
814 
1
595 
2020 Q4
13
600 
0
--- 
2020 Q3
8
741 
0
--- 
2020 Q2
3
627 
0
--- 
2020 Q1
4
696 
0
--- 
2019 Q4
15
585 
1
748 
2019 Q3
14
500 
0
--- 
2019 Q2
4
433 
0
--- 
2019 Q1
7
805 
1
191 
2018 Q4
15
688 
1
325 
2018 Q3
6
1 094 
0
--- 
2018 Q2
10
656 
0
--- 
2018 Q1
9
563 
1
310 
2017 Q4
11
625 
0
--- 
2017 Q3
10
584 
0
--- 
2017 Q2
13
1 104 
0
--- 
2017 Q1
6
844 
0
--- 
2016 Q4
6
370 
0
--- 
2016 Q3
6
705 
0
--- 
2016 Q2
8
502 
1
585 
2016 Q1
3
1 083 
0
--- 
2015 Q4
15
792 
0
--- 
2015 Q3
9
849 
1
722 
2015 Q2
5
1 167 
0
--- 
2015 Q1
10
700 
0
--- 
2014 Q4
3
1 261 
0
--- 
2014 Q3
9
1 014 
2
294 
2014 Q2
7
328 
0
--- 
2014 Q1
7
753 
0
--- 

Mayenne (53)

Most expensive cities

City
name
Descending orderHouses
house
Price per m²
2 368 
2 117 
2 030 
2 029 
1 989 
1 983 
1 920 
1 910 
City
name
Descending orderApartments
apt.
Price per m²
2 497 
2 138 
2 093 
1 992 
1 951 
1 597 
1 481 

Least expensive cities

City
name
Ascending orderHouses
house
Price per m²
594 
686 
694 
719 
City
name
Ascending orderApartments
apt.
Price per m²
151 
151 
156 
170 
202