emooki
HomePrice mapTransactions
🇬🇧 English🇫🇷 Français🇩🇪 Deutsch🇪🇸 Español🇮🇹 Italiano

Real estate price map


Real estate price map in the municipality of Cossé-le-Vivien, choose a section to see transactions by parcel.

Mayenne (53)
Cossé-le-Vivien

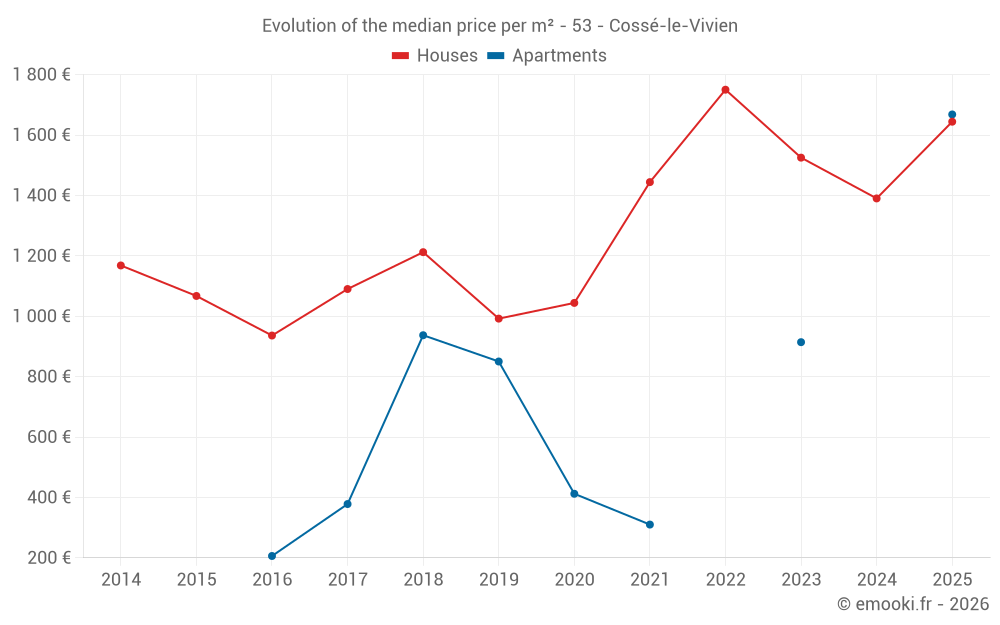
Median price of real estate
in the municipality of Cossé-le-Vivien

HousesHouses
1 496  /m²
1-23-45-67-89-10
Reliability 8/10
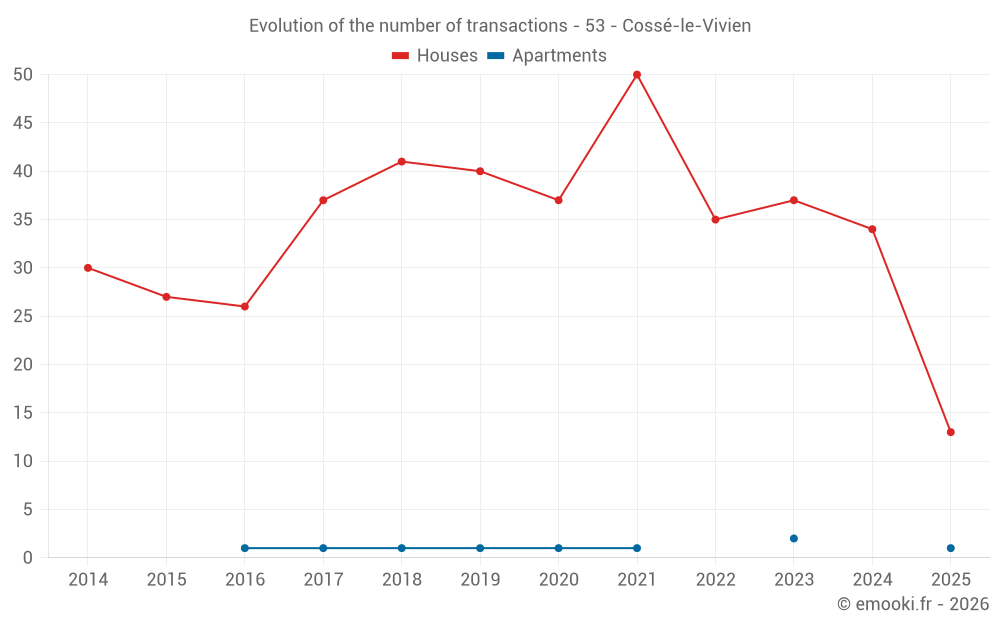
Median price on the 33 transactions of the last 12 months.
from 1 019 to
1 914  /m²
60% of transactions from the 2nd to the 8th deciles.
ApartmentsApartments
855  /m²
1-23-45-67-89-10
Reliability 3/10
Median price on the 6 transactions of the last 72 months.
DwellingsDwellings
1 524  /m²
1-23-45-67-89-10
Reliability 8/10
Median price on the 34 transactions of the last 12 months.
from 1 028 to
1 903  /m²
60% of transactions from the 2nd to the 8th deciles.
HousesEvolution of the price per m² of houses since...
1 year
+18%
2 years
+7.8%
3 years
-6.1%
4 years
+14%
5 years
+57%
6 years
+66%
7 years
+36%
8 years
+51%
9 years
+76%
10 years
+54%
11 years
+41%
The price per m² of houses has decreased by 6.1% since 3 years, but it has increased by 76% in 9 years.

Yearly evolution

Evolution of the median price per m²

Evolution of the number of transactions

Warning, last year incomplete. Projections made based on the proportions between semesters of the previous year at the departmental/national level and by type of property.

Yearly data

Descending order
Year
Houses
house
transactions
Houses
house
Price per m²
Apartments
apt.
transactions
Apartments
apt.
Price per m²
2025
13
1 644 
1
1 668 
2024
34
1 390 
0
--- 
2023
37
1 525 
2
914 
2022
35
1 750 
0
--- 
2021
50
1 444 
1
310 
2020
37
1 044 
1
412 
2019
40
992 
1
850 
2018
41
1 212 
1
937 
2017
37
1 090 
1
378 
2016
26
936 
1
206 
2015
27
1 067 
0
--- 
2014
30
1 168 
0
--- 

Analysis

Structure of prices per m²

Values of price percentiles per m² over the periods used for the estimated price of each type of property.

Structure of transaction amounts

Values of transaction amounts percentiles over the periods used for the estimated price of each type of property.

Transaction amounts and prices per m² by percentile

Ascending order
Percentile
Houses
house
Price per m²
Houses
house
Transaction amount
Apartments
apt.
Price per m²
Apartments
apt.
Transaction amount
10th percentile
590 
48 600 
361 
42 500 
20th percentile
1 019 
90 000 
412 
45 000 
30th percentile
1 088 
109 K
631 
56 500 
40th percentile
1 328 
132 K
850 
68 000 
50th percentile
1 496 
146 K
855 
80 000 
60th percentile
1 651 
161 K
860 
92 000 
70th percentile
1 712 
176 K
914 
123 K
80th percentile
1 914 
186 K
969 
154 K
90th percentile
2 192 
209 K
1 318 
187 K

National and departmental comparison

Evolution of the median price per m² of houses

Evolution of the median price per m² of apartments

Quarterly evolution

Evolution of the median price per m²

Evolution of the number of transactions

Quarterly data

Descending order
Quarter
Houses
house
transactions
Houses
house
Price per m²
Apartments
apt.
transactions
Apartments
apt.
Price per m²
2025 Q2
4
1 124 
0
--- 
2025 Q1
9
1 698 
1
1 668 
2024 Q4
10
1 488 
0
--- 
2024 Q3
10
1 242 
0
--- 
2024 Q2
4
1 154 
0
--- 
2024 Q1
10
1 018 
0
--- 
2023 Q4
13
1 435 
1
860 
2023 Q3
8
1 414 
1
969 
2023 Q2
4
1 786 
0
--- 
2023 Q1
12
1 561 
0
--- 
2022 Q4
9
1 826 
0
--- 
2022 Q3
12
1 935 
0
--- 
2022 Q2
6
1 749 
0
--- 
2022 Q1
8
1 613 
0
--- 
2021 Q4
13
1 579 
0
--- 
2021 Q3
13
1 474 
0
--- 
2021 Q2
10
1 094 
0
--- 
2021 Q1
14
1 308 
1
310 
2020 Q4
12
1 055 
0
--- 
2020 Q3
10
954 
0
--- 
2020 Q2
9
1 000 
0
--- 
2020 Q1
6
1 016 
1
412 
2019 Q4
8
1 148 
1
850 
2019 Q3
13
1 000 
0
--- 
2019 Q2
10
974 
0
--- 
2019 Q1
9
810 
0
--- 
2018 Q4
9
1 034 
0
--- 
2018 Q3
6
932 
1
937 
2018 Q2
13
1 205 
0
--- 
2018 Q1
13
1 412 
0
--- 
2017 Q4
8
1 042 
0
--- 
2017 Q3
9
1 103 
1
378 
2017 Q2
12
993 
0
--- 
2017 Q1
8
1 056 
0
--- 
2016 Q4
5
1 043 
0
--- 
2016 Q3
13
771 
0
--- 
2016 Q2
6
936 
0
--- 
2016 Q1
2
1 181 
1
206 
2015 Q4
12
932 
0
--- 
2015 Q3
8
1 630 
0
--- 
2015 Q2
2
1 078 
0
--- 
2015 Q1
5
1 031 
0
--- 
2014 Q4
8
1 025 
0
--- 
2014 Q3
14
1 232 
0
--- 
2014 Q2
6
1 088 
0
--- 
2014 Q1
2
1 386 
0
--- 

Overview of the latest real estate transactions

The following list is an anonymized overview of the latest transactions. For more details and to find all transactions, please use the map to view transactions by plot or the transaction search page for a search by criteria.

2025-06-30
90 000 
1 047  /m²(86 m²)
Sale
Houses
House
4 rooms
86 m2
Land
310 m2
-Sols
2025-05-22
2 500 
Sale
1 outbuilding
Land
276 m2
-Jardins
/Jardin potager
2025-05-05
18 434 
Sale
Land
7564 m2
-Terres
Land
199 m2
-Terres
Land
352 m2
-Terres
Land
264 m2
-Terres
2025-04-29
50 000 
Sale
2 outbuildings
Land
500 m2
-Terrains à bâtir
Land
254 m2
-Sols
2025-04-25
42 000 
1 200  /m²(35 m²)
Sale
Houses
House
1 room
35 m2
1 outbuilding
Land
159 m2
-Sols
2025-04-17
25 000 
446  /m²(56 m²)
Sale
Houses
House
4 rooms
56 m2
Land
29 m2
-Sols
2025-04-16
205 000 
1 680  /m²(122 m²)
Sale
Houses
House
5 rooms
122 m2
2 outbuildings
Land
318 m2
-Sols
Land
227 m2
-Sols
2025-03-31
180 000 
1 698  /m²(106 m²)
Sale
Houses
House
4 rooms
106 m2
Land
495 m2
-Sols
2025-03-27
90 000 
542  /m²(166 m²)
Sale
Houses
House
4 rooms
83 m2
Houses
House
4 rooms
83 m2
Land
496 m2
-Sols
2025-03-27
118 000 
992  /m²(119 m²)
Sale
Commercial property
119 m2
Land
85 m2
-Sols
Land
84 m2
-Sols
2025-03-19
50 
Exchange
Land
33 m2
-Sols
Land
7 m2
-Sols
Land
13 m2
-Terrains d'agrément
Land
4 m2
-Terres
2025-03-19
153 500 
1 668  /m²(92 m²)
Sale
Apartments
Apartment
2 rooms
20 m2
Apartments
Apartment
2 rooms
20 m2
Apartments
Apartment
3 rooms
52 m2
Land
89 m2
-Sols
2025-03-14
305 000 
1 943  /m²(157 m²)
Sale
Houses
House
4 rooms
157 m2
1 outbuilding
Land
4287 m2
-Terrains d'agrément
Land
5000 m2
-Sols
2025-03-11
2 786 
Sale
Land
2694 m2
-Terres
2025-03-10
28 000 
Sale
Land
13056 m2
-Prés
Land
2262 m2
-Prés
2025-03-07
75 000 
781  /m²(96 m²)
Sale
Houses
House
5 rooms
96 m2
1 outbuilding
Land
259 m2
-Sols
2025-03-06
6 800 
Sale
Land
105 m2
-Terrains d'agrément
2025-03-03
178 000 
2 225  /m²(80 m²)
Sale
Houses
House
2 rooms
80 m2
1 outbuilding
Land
364 m2
-Sols
2025-03-03
106 800 
1 618  /m²(66 m²)
Sale
Houses
House
3 rooms
66 m2
Land
130 m2
-Sols
2025-02-14
145 000 
1 726  /m²(84 m²)
Sale
Houses
House
5 rooms
84 m2
Land
25 m2
-Sols
Land
579 m2
-Sols
816 transactions listed in the municipality

Mayenne (53)

Most expensive cities

City
name
Descending orderHouses
house
Price per m²
2 368 
2 117 
2 030 
2 029 
1 989 
1 983 
1 920 
1 910 
City
name
Descending orderApartments
apt.
Price per m²
2 497 
2 138 
2 093 
1 992 
1 951 
1 597 
1 481 

Least expensive cities

City
name
Ascending orderHouses
house
Price per m²
594 
686 
694 
719 
City
name
Ascending orderApartments
apt.
Price per m²
151 
151 
156 
170 
202